R package for generating indicators from OBIS
Example Plots
Animated map of OBIS data limited to 1M randomly selected records per decade: 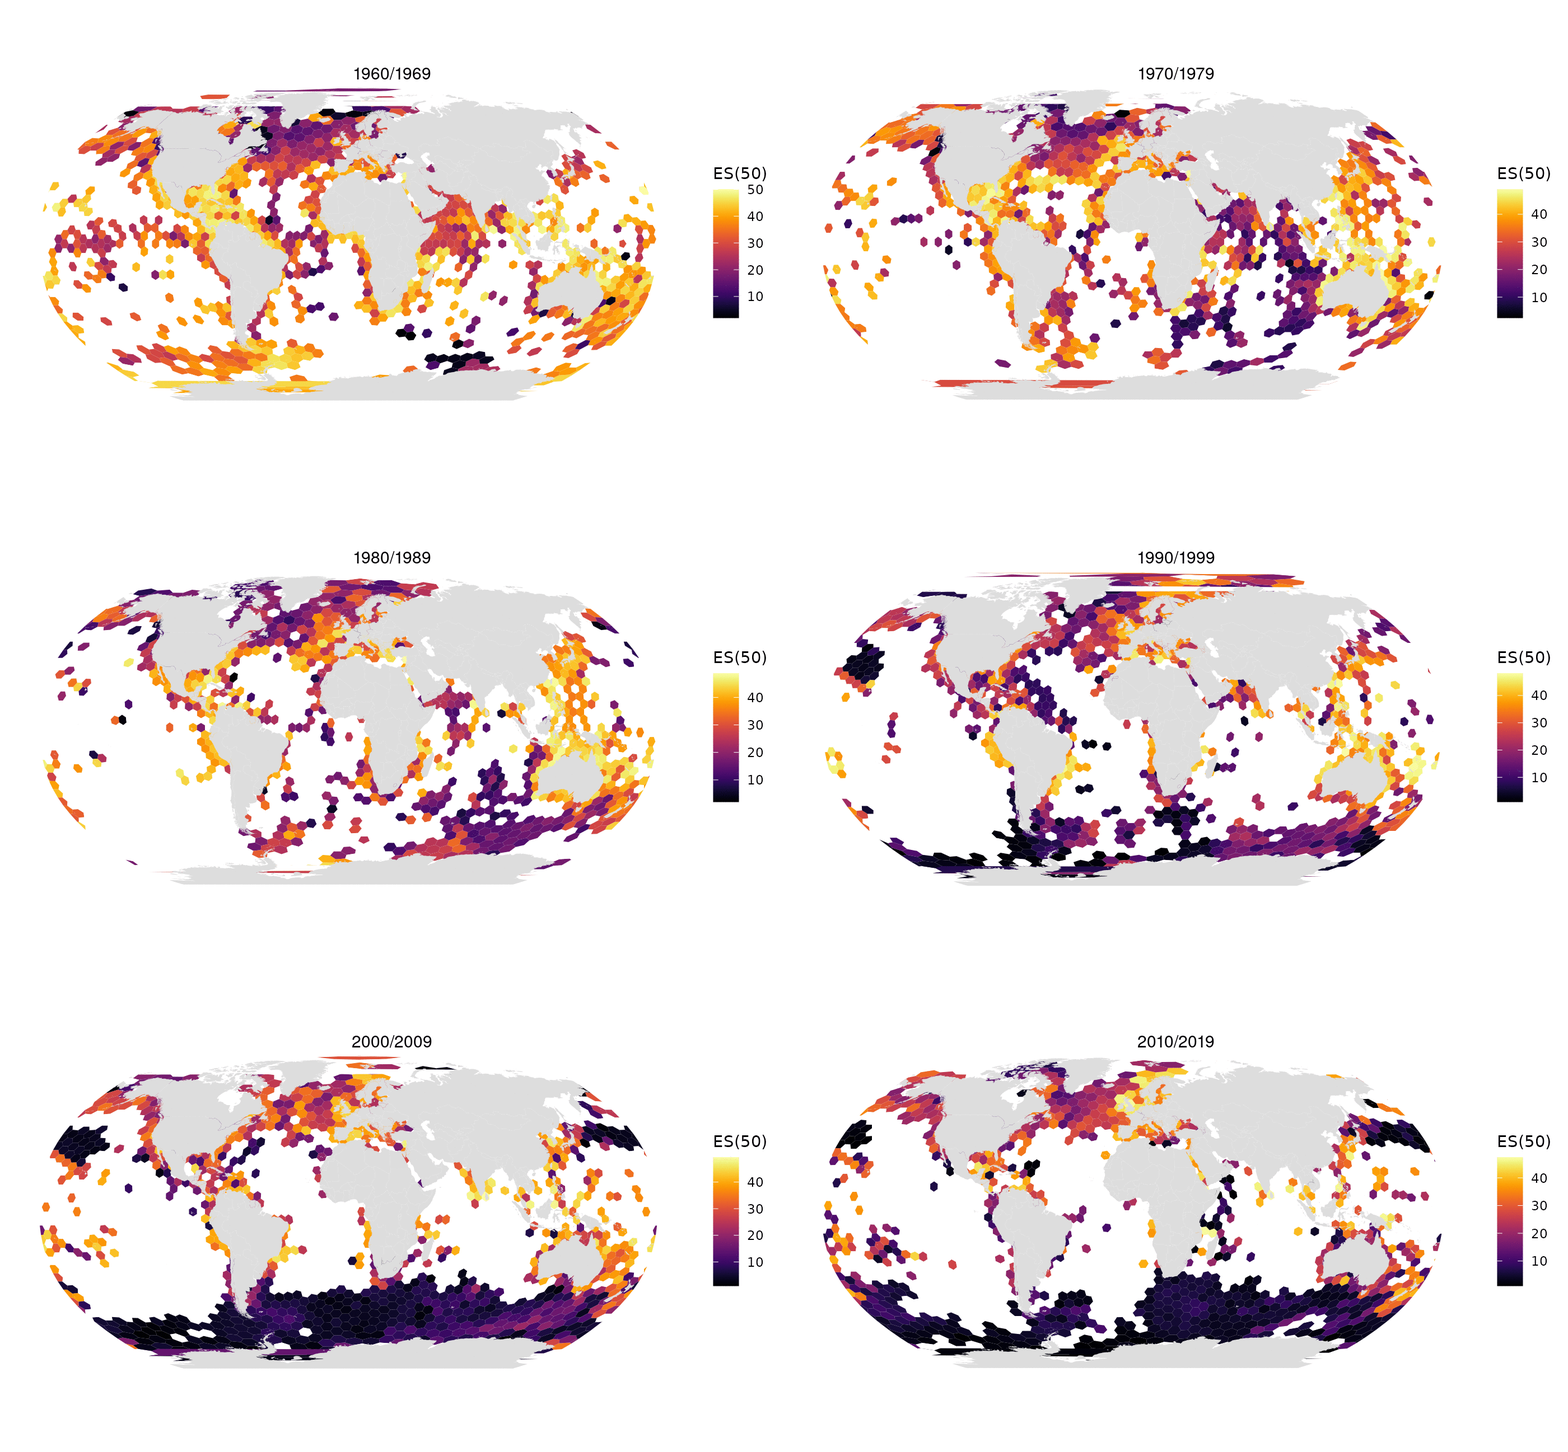
All data from OBIS in one map: 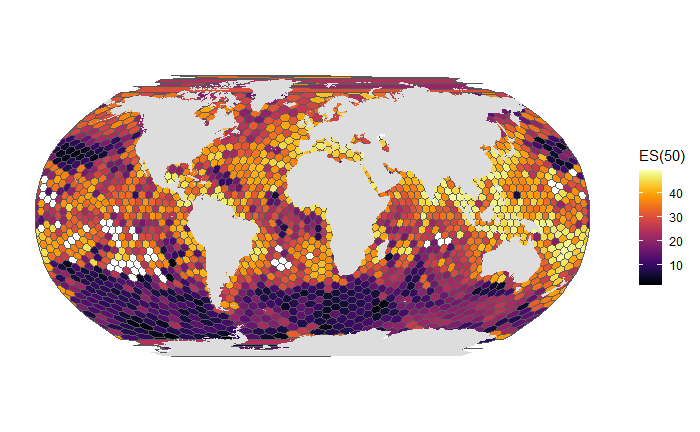
Install
Basic installation is simple:
remotes::install_github("marinebon/obisindicators")But you will also need to install dependencies. You will need to install RTools and devtools to do this. Once those are installed run the following to complete installation of this package and its dependencies:
devtools::install_local()notes for ubuntu 22
Note that you will need to install R and the devtools package before being able to install this R package. As of 2022 October, these are the commands that were needed to install all required dependencies on a fresh ubuntu 22 installation:
# dependencies that R can't install for devtools
sudo apt-get install r-base libfontconfig1-dev libcurl4-openssl-dev libharfbuzz-dev libfribidi-dev libxml2-dev libfreetype6-dev libpng-dev libtiff5-dev libjpeg-dev
# dependencies that R can't install for obisindicator's dependencies
sudo apt-get install libgsl-dev libgdal-dev
install.packages("devtools")
devtools::install_local()Data layout
obis_h3_export_parquet() writes an obis_h3 store to the obis-h3 release, a folder of hive-partitioned Parquet that a static web app reads with DuckDB-WASM. Every indicator file has the columns h3 (hex string), cell_id, n, sp, shannon, simpson, es; the partition keys are in the path, and each partition is exactly one data_0.parquet.
<release>/
  release.json                                     layers, row counts, columns, notes
  collection.json                                  STAC Collection (Ocean Metrics h3 profile)
  files.parquet                                    manifest: layer, path, url_path, rows, bytes, parent
  stats.parquet                                    value ranges per layer x key x decade x year x res x variable
  taxon_groups.parquet                             the taxa and EOVs on offer, with totals and paths
  all/res=<1..5>/data_0.parquet                    all taxa, all years
  all/res=<6,7>/p=<parent>/data_0.parquet          res 6 and 7 split by res-2 / res-3 parent cell
  eov/eov=<eov>/res=<r>/                           per Essential Ocean Variable
  taxon/rank=<rank>/taxon=<taxon>/res=<r>/         per phylum, class, order, family
  decade/all/decade=<yyy0>/res=<r>/                per decade (res 1-5)
  decade/eov/eov=<eov>/decade=<yyy0>/res=<r>/      per decade and EOV
  year/all/year=<yyyy>/res=<r>/                    per year, every year present (res 1-5)
  year/eov/eov=<eov>/year=<yyyy>/res=<r>/          per year and EOV
  species/res=<3,4,5>/class=<class>/data_0.parquet species x hex x count: h3, cell_id, name_key, aphiaid, n
  species/species.parquet                          one row per aphiaid: name_key, names, ranks, lineage, records, eov
  species/lineage.parquet                          aphiaid, name_key, lineage only (a subtree without the names)
  species/heads.json                               taxa that still need a pre-aggregated head
  species_decade/res=<r>/decade=<d>/class=<class>/ per decade (species_decades = TRUE only)
  species_flat/res=<1,2,3>.parquet                 every class in one cell-sorted file per res (res 1-2 rolled up)
  species_flat/res=3/p=<res-1 parent>.parquet      res 3 split by res-1 parent, no h3 column (the Cell pane)
  place/coll=<slug>/data_0.parquet                 per-place pooled indicators (place_collections only)
  place_exact/coll=<slug>/indicators.parquet       exact point-in-polygon indicators, plus years.parquet
                                                   and meta.json (place_exact only)
The species table answers a WoRMS subtree, or the species of a cell, in the browser: its files are sorted by cell_id, aphiaid, so a cell reads one row group, and a NULL class is written class=_none. A subtree is the aphiaids whose lineage contains the taxon; obis_h3_species_subtree_sql() writes that query, and it matches the store’s own subtree SQL cell for cell. Richness counts species names (name_key), not aphiaids. Taxa spanning several classes (Animalia, and the 125 taxa listed in heads.json for the 2026-10 global store) read many class files, so they are to get pre-aggregated heads in the next version.
Developer Stuff
Setup
devtools::install_local()
testthat::test_local()
When editing locally, you will need to reload the obisindicators from your local copy of the files. To do this use devtools::load_all(). Additionally, you will need to run document() to update things from roxygen docstrings. All of this is summarized in the cheatsheet in RStudio under Help > Cheat Sheets > Package Dev w/ Devtools. You must use the workflow outlined in that pdf or you are gonna have a bad time.
Awesome-obisindicators usage from the community
| project | description |
|---|---|
| global-obis-es50 | Global biodiversity assessment. |
| california-coast-ecostress-biodiversity/ | Biodiversity assessment of the CA coast as relevant to NASA EcoSTRESS data. |
| OHW22 Galapagos analysis | Biodiversity assessment in the Galapagos with and without newly collected data. |
| es50 on a globe! | outputs from this library wrapped on an interactive globe in your browser |
Notes on creating vignettes
- create new vignettes via
usethis::use_vignette("new_vignette_name") - to pre-build a vignette
- set chunk’s
evalis false - then put markdown into the vignette to display the output image (or other html)
- assets go in
vignettesor inman/figures[ref)
- set chunk’s