library(obisindicators)
#> Warning: replacing previous import 'h3::compact' by 'purrr::compact' when
#> loading 'obisindicators'
library(dplyr)
#>
#> Attaching package: 'dplyr'
#> The following objects are masked from 'package:stats':
#>
#> filter, lag
#> The following objects are masked from 'package:base':
#>
#> intersect, setdiff, setequal, union
library(sf)
#> Linking to GEOS 3.12.1, GDAL 3.8.4, PROJ 9.4.0; sf_use_s2() is TRUE
plot_the_hex_grid <- function(occ_df){
hex_res <- 1 # hex_res 0 is too big to work, all others work
hex <- obisindicators::make_hex_res(hex_res)
# mapview::mapview(hex) # you can view the hex grid with h3 IDs
# === Then assign cell numbers to the occurrence data:
occ_df <- occ_df %>%
mutate(
cell = h3::geo_to_h3(
data.frame(decimalLatitude, decimalLongitude),
res = hex_res)) # calc indicators
idx <- calc_indicators(occ_df)
# Add cell geometries to the indicators table:
grid <- hex %>%
inner_join(
idx,
by = c("hexid" = "cell"))
# Plot map
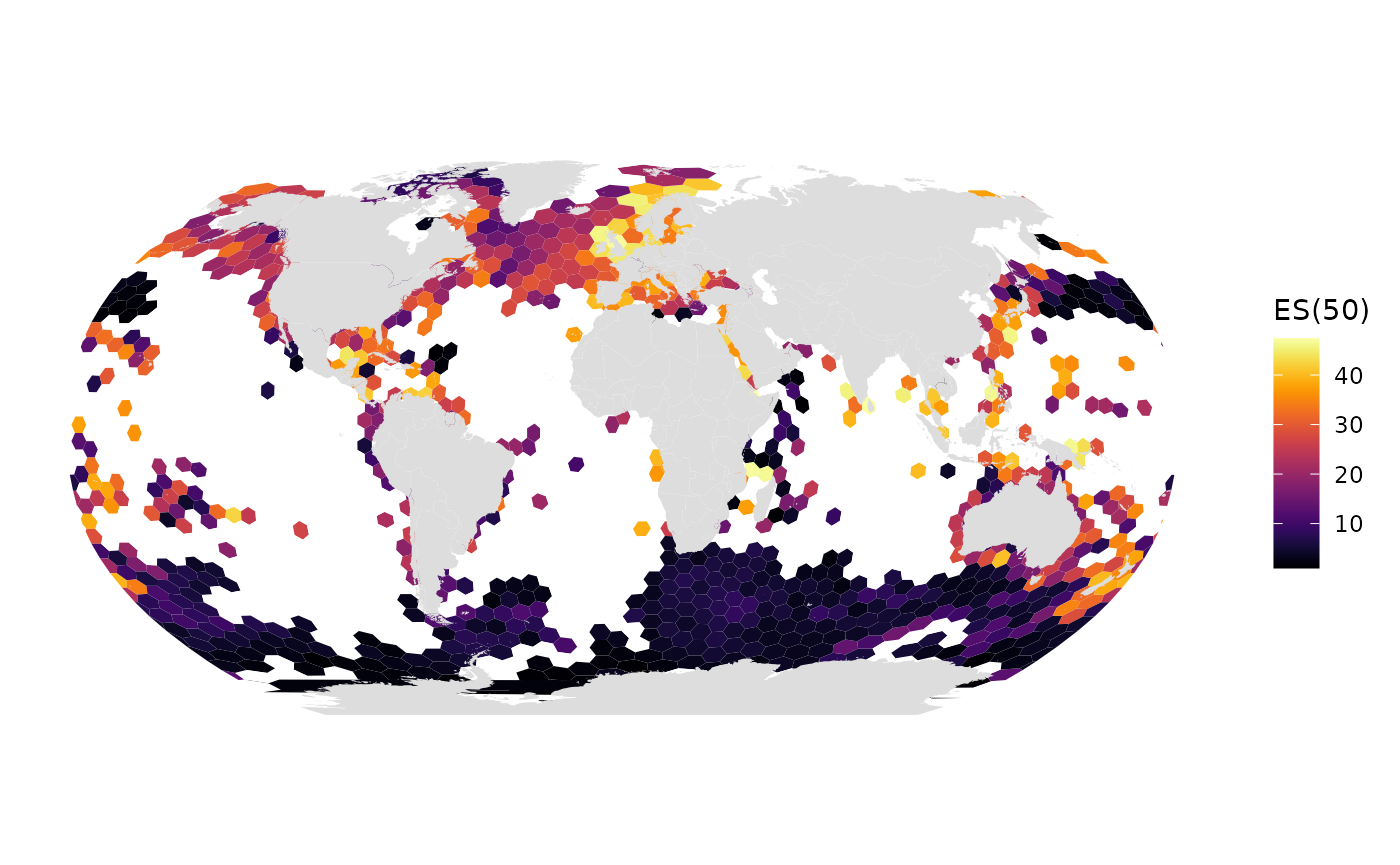
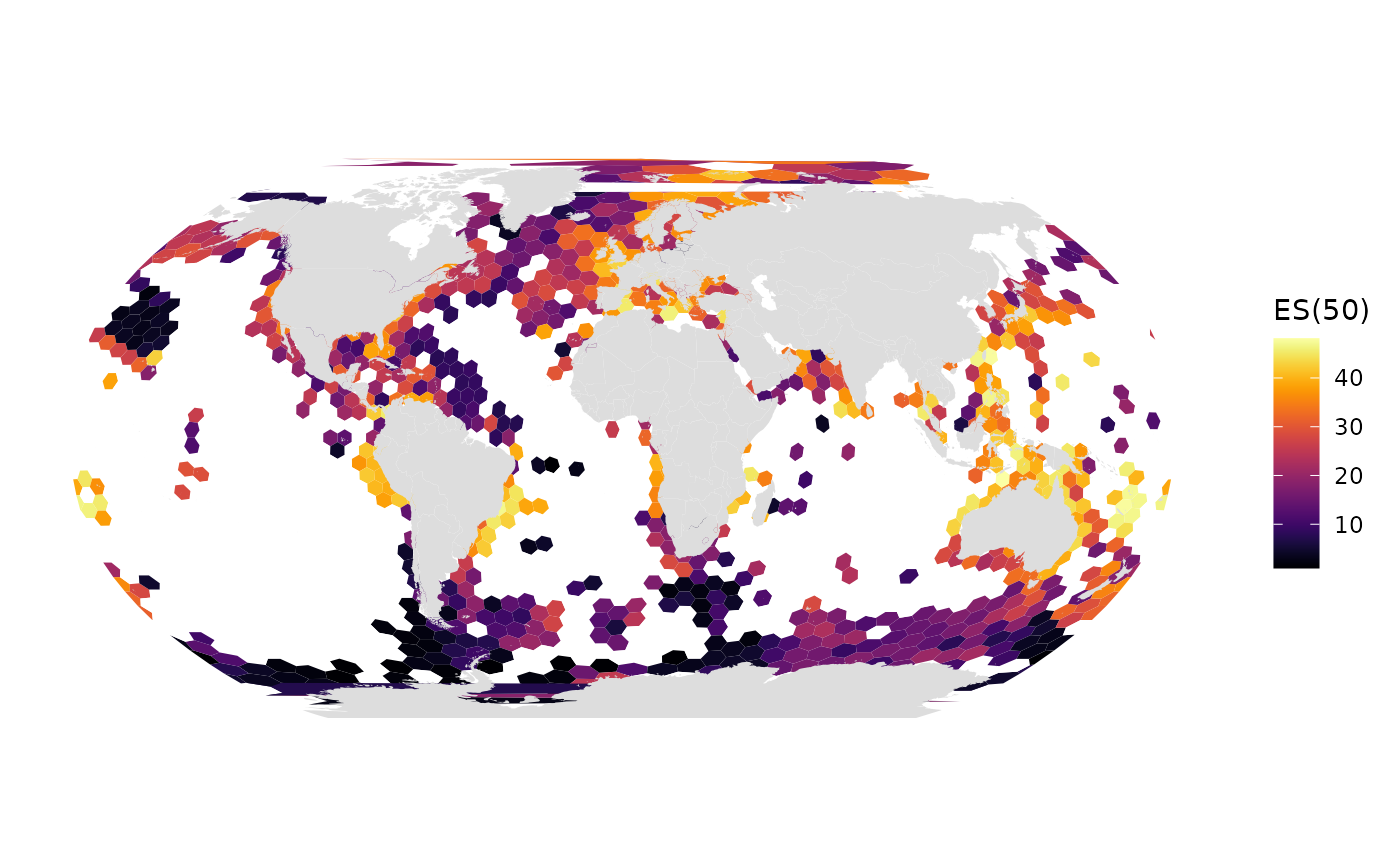
gmap_indicator(grid, "es", label = "ES(50)")
}
plot_the_hex_grid(occ_1960s)
#> Warning: `aes_string()` was deprecated in ggplot2 3.0.0.
#> ℹ Please use tidy evaluation idioms with `aes()`.
#> ℹ See also `vignette("ggplot2-in-packages")` for more information.
#> ℹ The deprecated feature was likely used in the obisindicators package.
#>   Please report the issue at
#>   <https://github.com/marinebon/obisindicators/issues>.
#> This warning is displayed once per session.
#> Call `lifecycle::last_lifecycle_warnings()` to see where this warning was
#> generated.
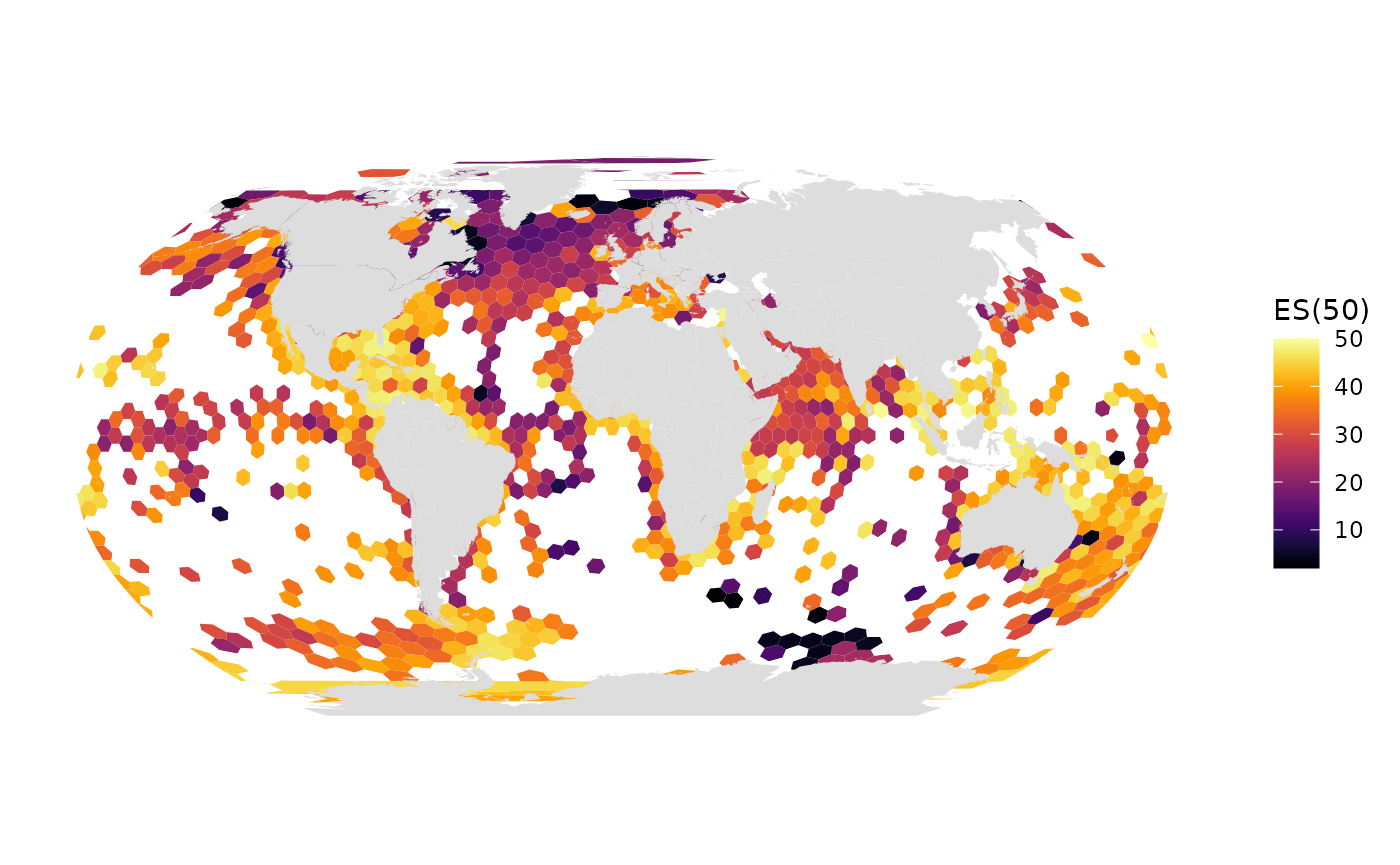
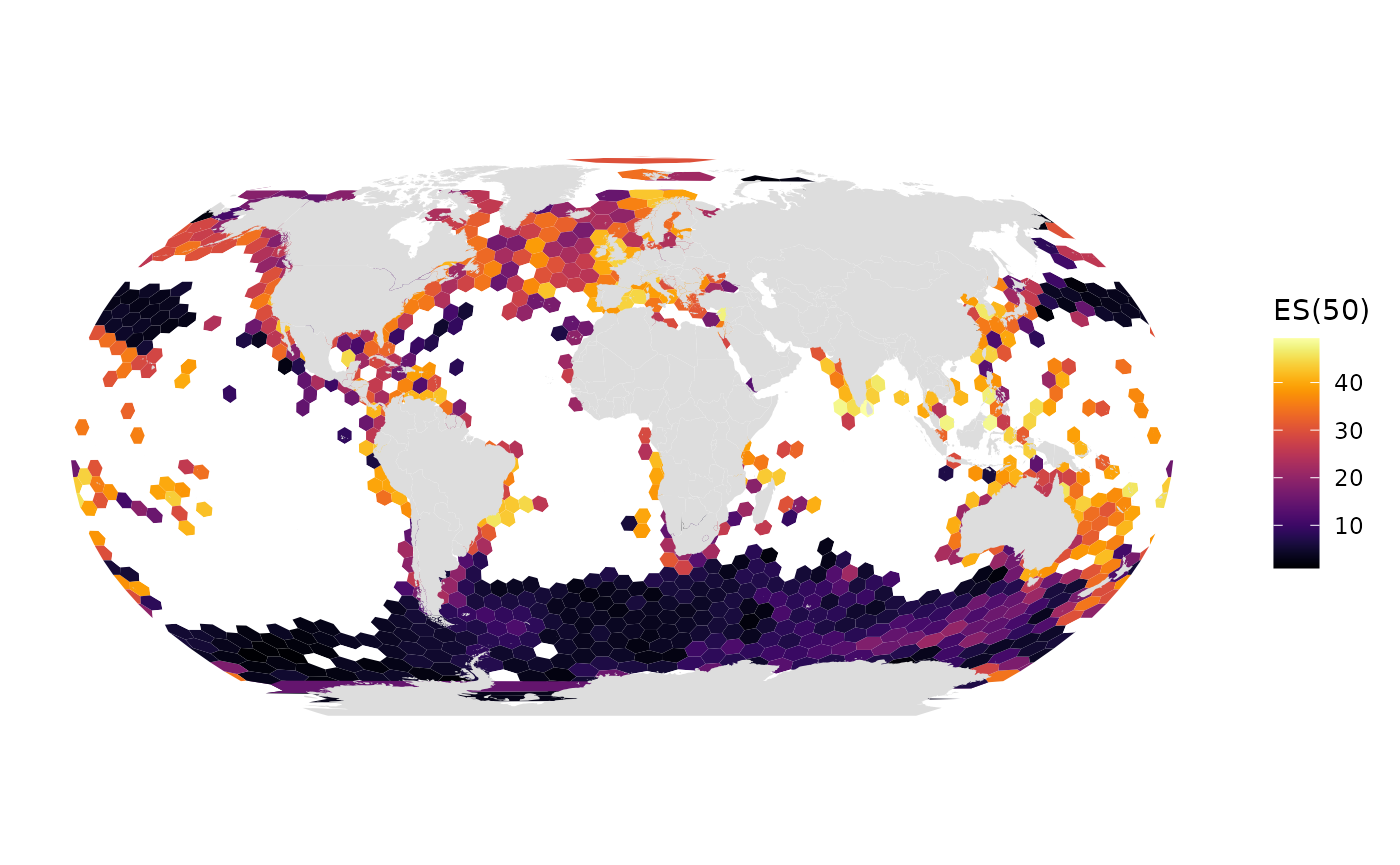
plot_the_hex_grid(occ_1970s)
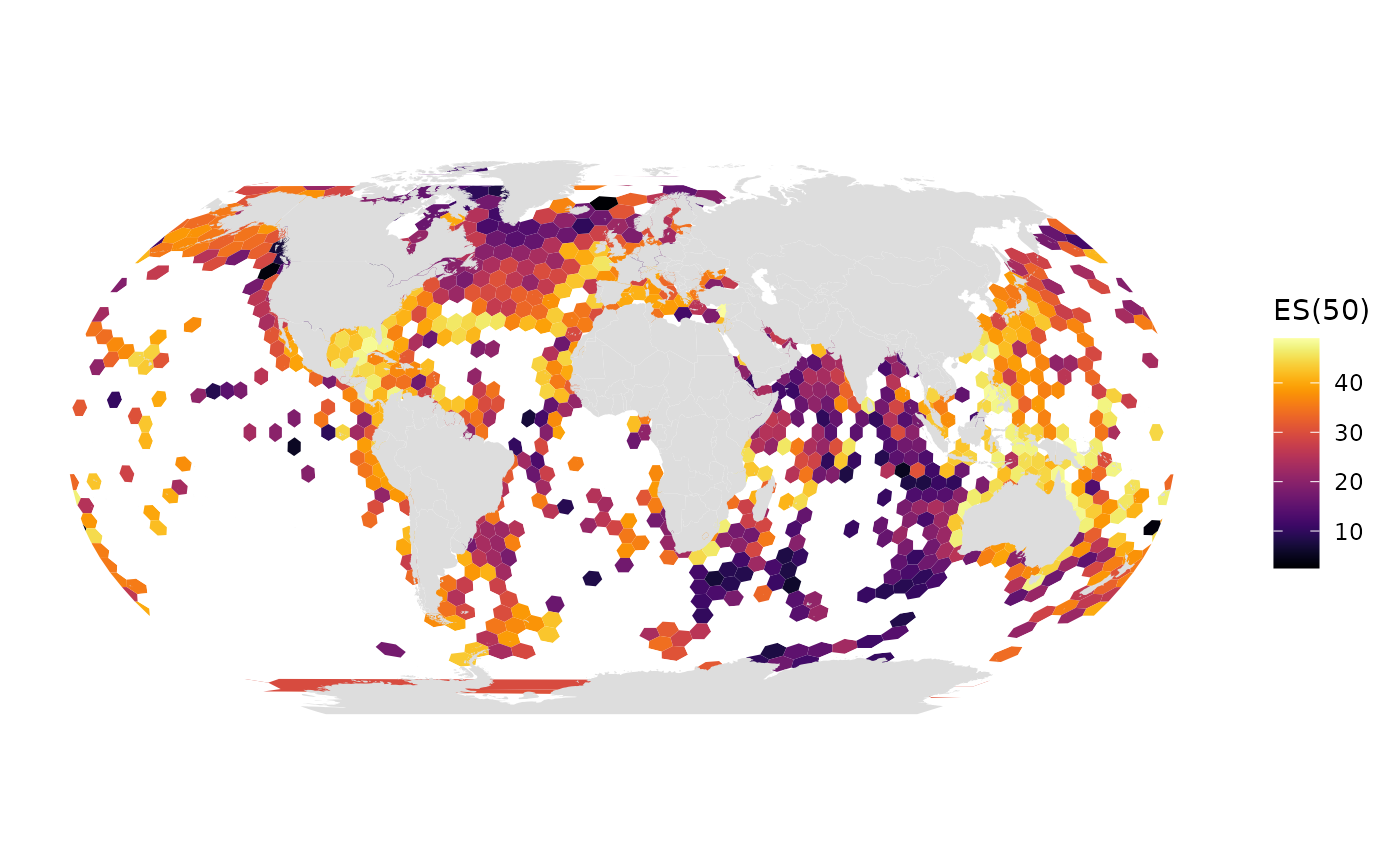
plot_the_hex_grid(occ_1980s)
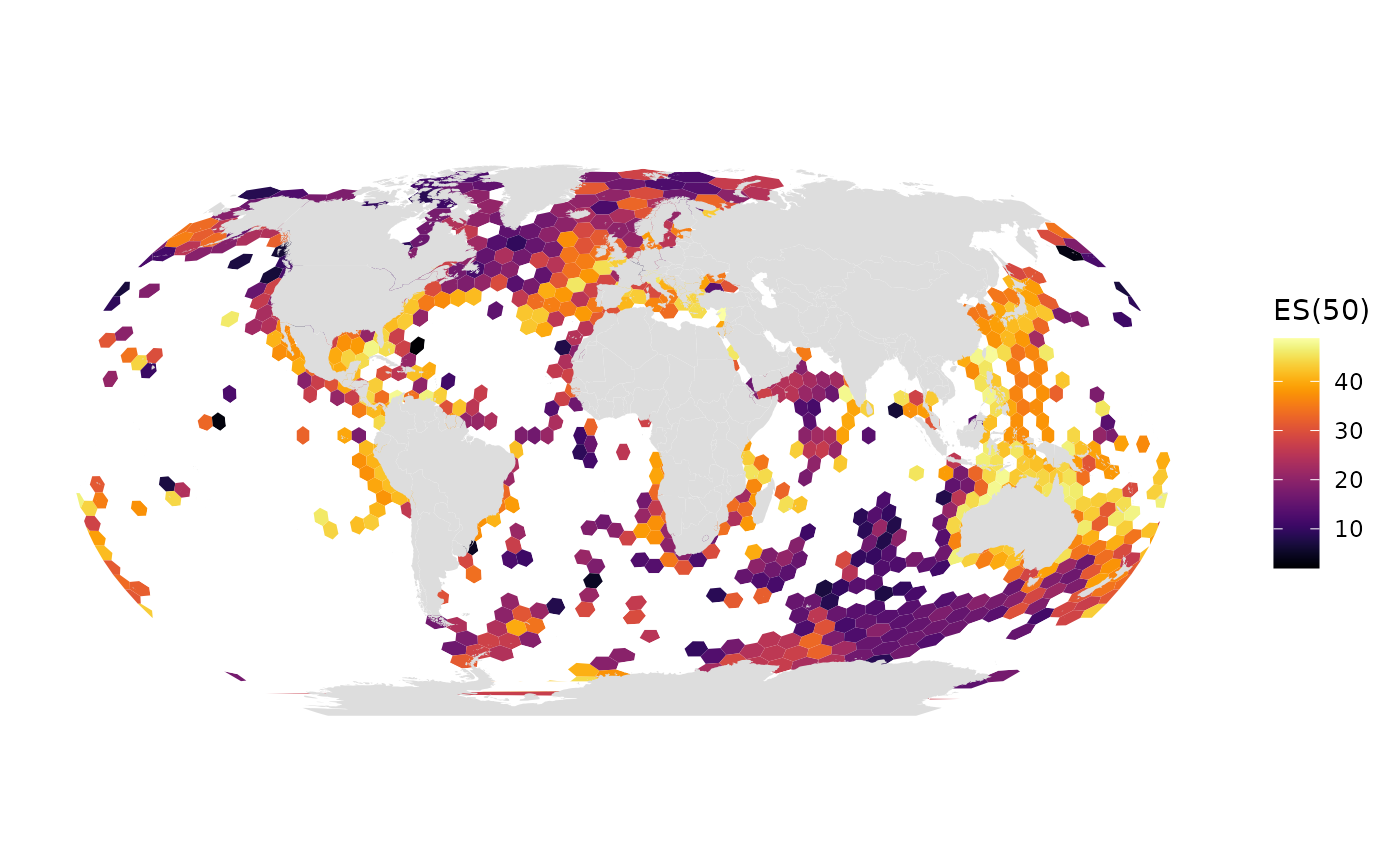
plot_the_hex_grid(occ_1990s)
plot_the_hex_grid(occ_2000s)
plot_the_hex_grid(occ_2010s)