
Indicators
Synthesizing raw observations into Essential Biodiversity Variables and Essential Ocean Variables for policy-relevant reporting.
The Indicators working group bridges raw observational data and decision-relevant reporting. Working group members develop, validate, and publish Essential Biodiversity Variables (EBVs) and Essential Ocean Variables (EOVs) derived from MBON node data streams.
Products include status-and-trends dashboards, indicator time series submitted to GEO BON, and synthesis papers linking biodiversity indicators to ecosystem services and climate-change impacts.

Indicators & Data Management
Raw observations become decision-relevant information through synthesis into Essential Ocean Variables, open data pipelines, and indicators that managers and policymakers can act on.
Learn more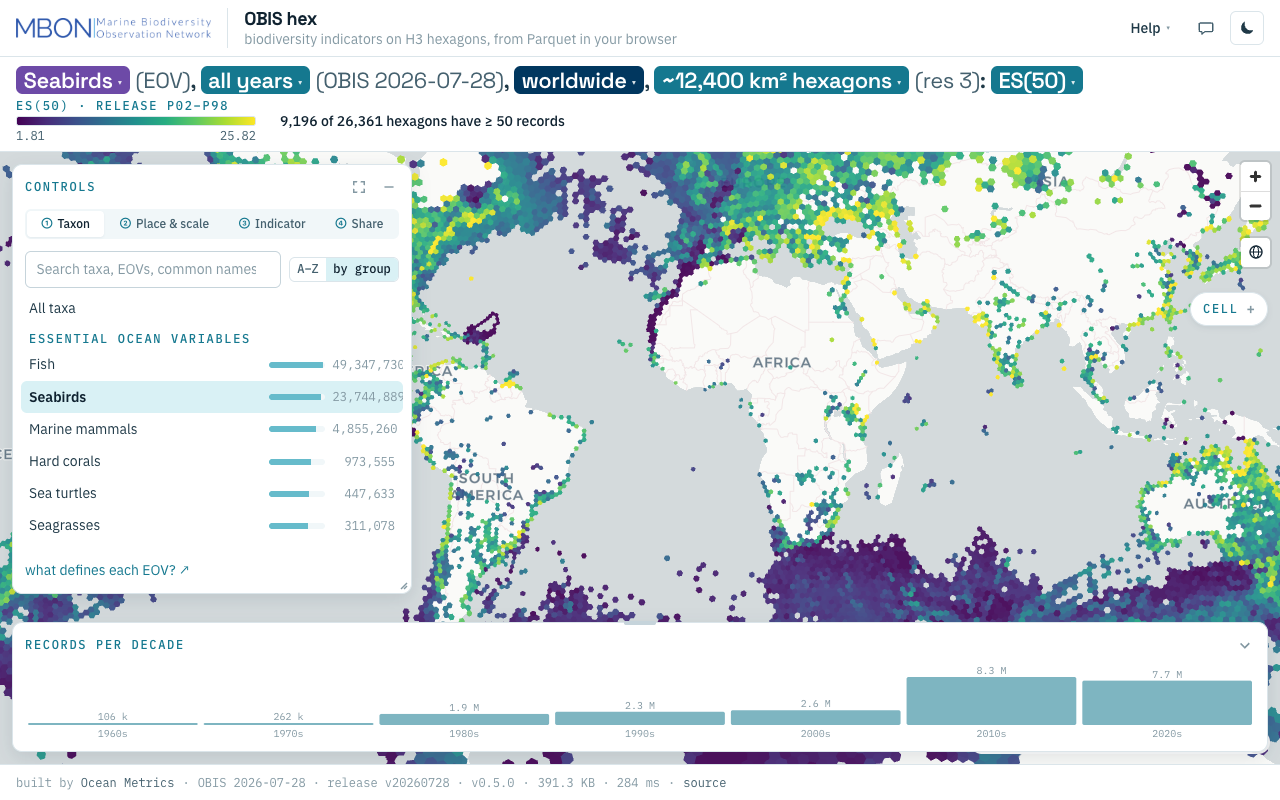
OBIS hex
Biodiversity indicators from every OBIS record on H3 hexagons, from ES(50) to records per decade, computed from Parquet in your browser with no server. The URL is the view.
Learn moreMarine Sensitivity Toolkit
A catalog and atlas of marine species distribution models and sensitivity scores for U.S. waters, harmonized with STAC-SDM into cloud-optimized GeoTIFF and GeoParquet.
Learn more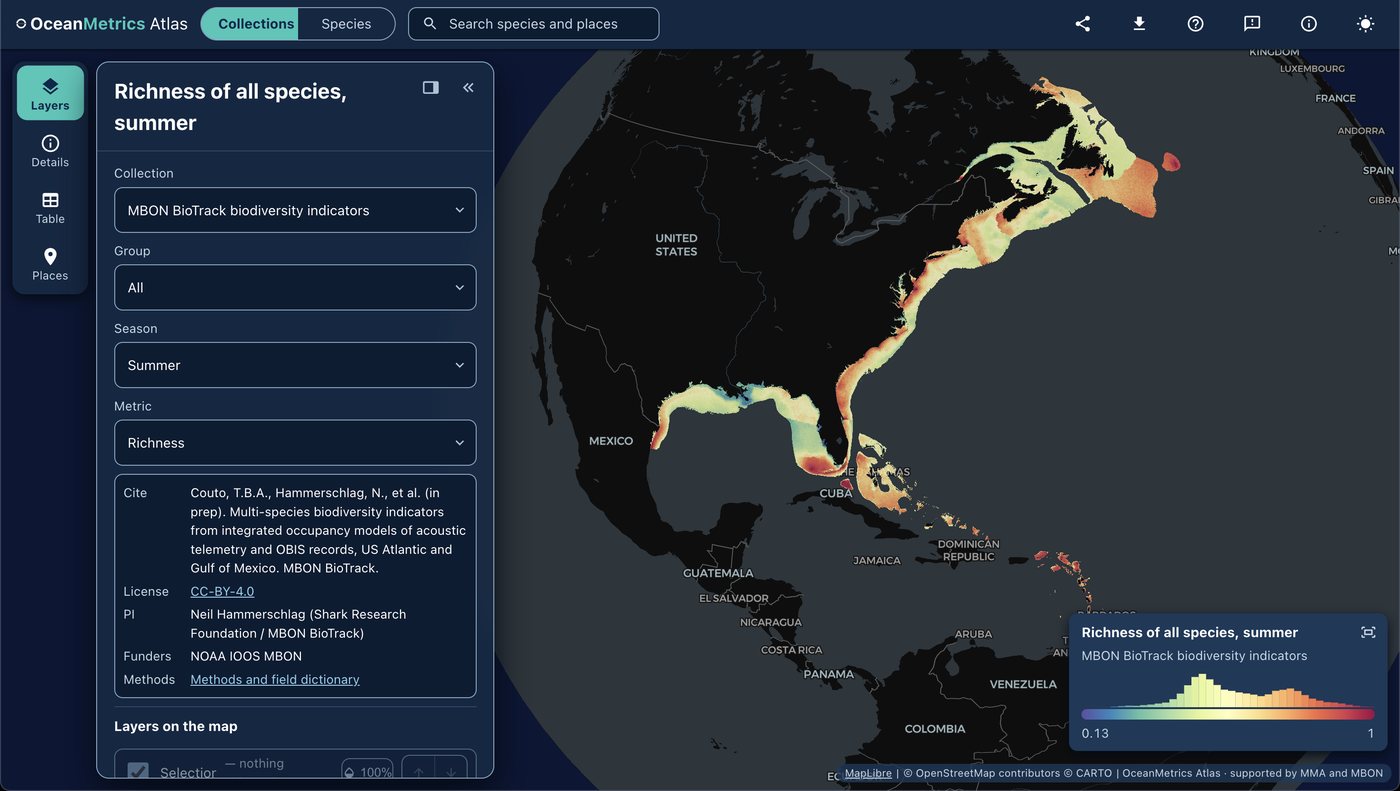
OceanMetrics Atlas
A browser map of species distribution and biodiversity model outputs, read from a STAC catalog. It opens on the AquaMaps EOV share and hosts the MBON BioTrack indicators (species richness and uncertainty from telemetry and OBIS).
Learn moreplaces gazetteer
One STAC catalog of marine place layers (sanctuaries, MPAs, EEZs, leases, planning areas) as GeoParquet and PMTiles, with stable place ids, per-feature licence and H3 membership for joining hexagon data by place.
Learn moreSTAC-SDM
A STAC extension that describes species distribution models (range, habitat-suitability or density) — what the value means, how it was modeled, which taxon, and the month or season it predicts.
Learn more