
OceanMetrics Atlas
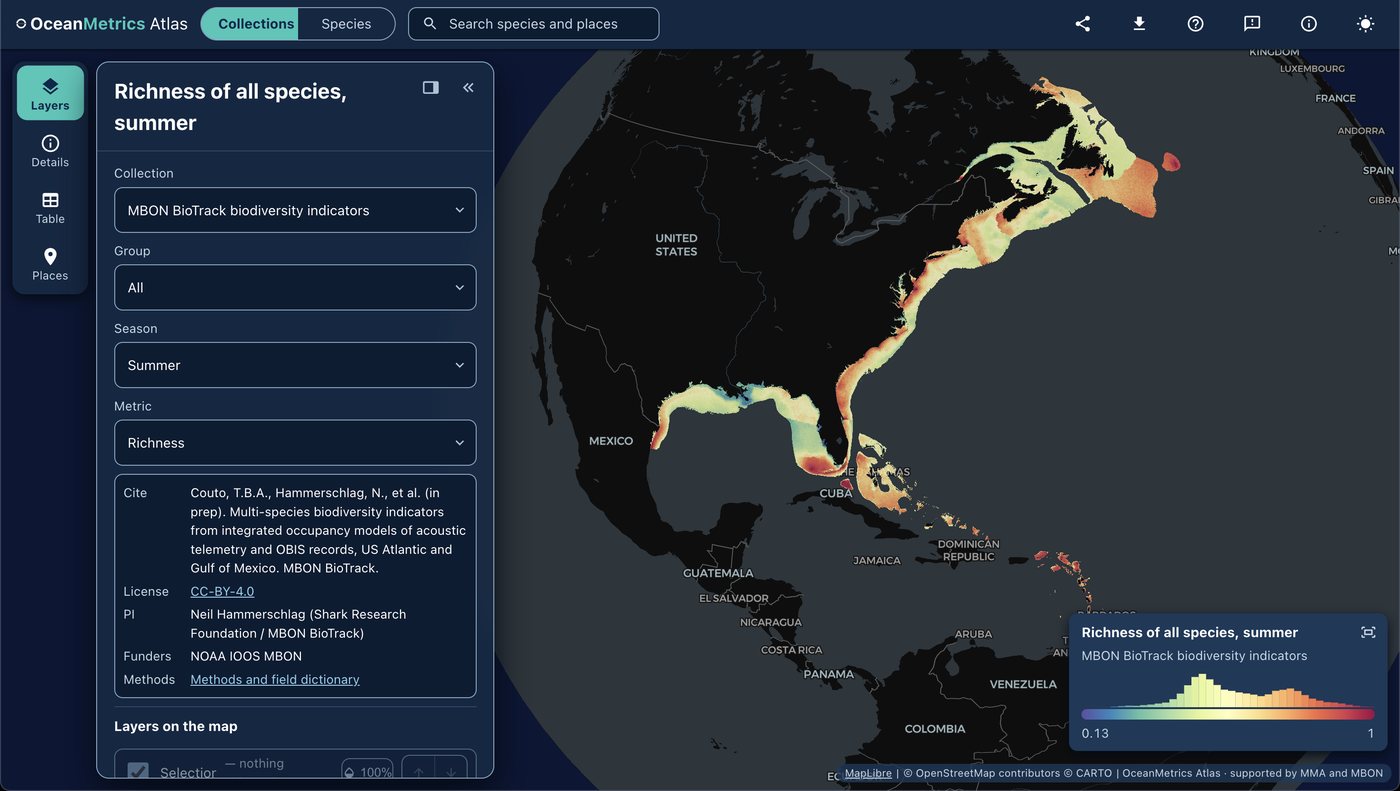
The OceanMetrics Atlas maps species distribution and biodiversity model outputs from a STAC catalog described with STAC-SDM . It runs entirely in the browser, with no server of its own, and takes its places from the places gazetteer .
AquaMaps EOV share. The atlas opens on it: a 0-100 score per 0.05° cell for each Essential Ocean Variable (fish, hard corals, mangroves, marine mammals, seabirds, seagrasses, sea turtles). For each EOV it sums every species’ share of its global AquaMaps habitat suitability in the cell, clipped to its IUCN range and weighted by Red List category; the composite is the mean of the EOVs with data. Click a cell for a flower plot of the EOVs and the list of species with habitat there, each linked to its own distribution. The method is a rendered notebook .
MBON BioTrack indicators. One pick away (open them ), the atlas hosts the BioTrack indicator layers (PI Neil Hammerschlag, funded by NOAA IOOS MBON). They give ecoregion-weighted species richness and cumulative uncertainty for the US Atlantic, the Gulf of Mexico and the Caribbean, on 27,841 10-km hexagons, in summer and winter. Layers cover all species, fish, rays, sharks, turtles and red-listed species. They come from integrated spatial occupancy models that combine acoustic telemetry with OBIS records for 66 species, from 2000 to 2023. Cite them as:
Couto, T. B. A., Zulian, V., D’Antonio, B., … & Hammerschlag, N. (under review). Unlocking the potential of acoustic telemetry to scale up marine biodiversity assessment. Frontiers in Ecology and the Environment.
The atlas also carries AquaMaps habitat suitability per species (native 0.5° and global 0.05°) and, by reference, the Marine Sensitivity Toolkit SDM collections. The atlas is built by Ocean Metrics, with support from the Marine Minerals Administration and MBON.
BioTrack
Mapping marine biodiversity hotspots by integrating satellite and acoustic animal tracking with remotely sensed environmental data.
Learn moreIndicators
Synthesizing raw observations into Essential Biodiversity Variables and Essential Ocean Variables for policy-relevant reporting.
Learn more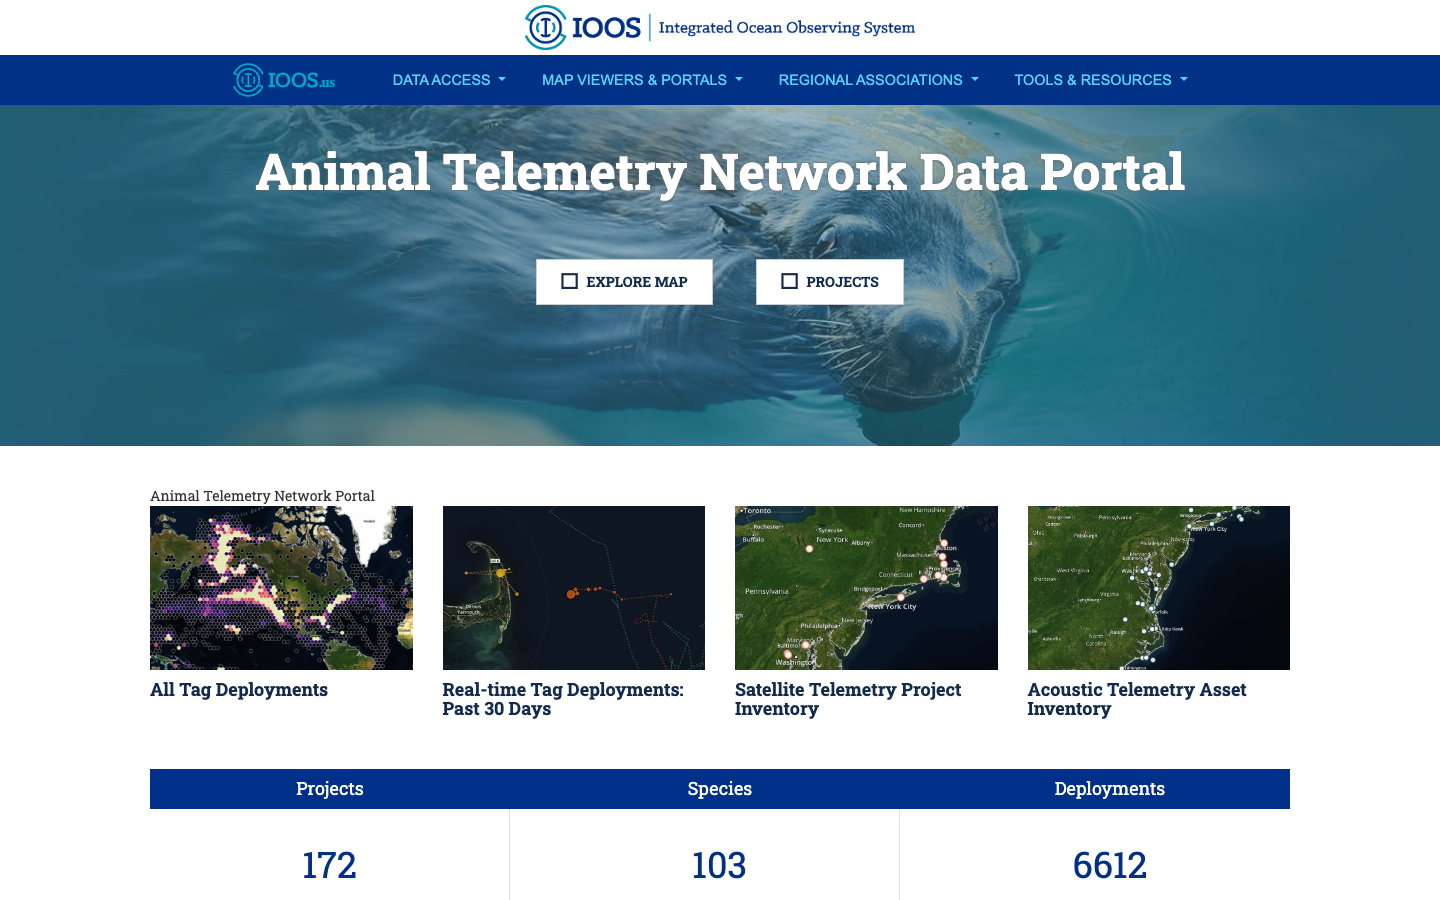
BioTrack Telemetry Portal
Interactive map of satellite and acoustic marine animal tracks that identifies biodiversity hotspots and their overlap with human-use areas.
Learn moreMarine Sensitivity Toolkit
A catalog and atlas of marine species distribution models and sensitivity scores for U.S. waters, harmonized with STAC-SDM into cloud-optimized GeoTIFF and GeoParquet.
Learn moreSTAC-SDM
A STAC extension that describes species distribution models (range, habitat-suitability or density) — what the value means, how it was modeled, which taxon, and the month or season it predicts.
Learn moreplaces gazetteer
One STAC catalog of marine place layers (sanctuaries, MPAs, EEZs, leases, planning areas) as GeoParquet and PMTiles, with stable place ids, per-feature licence and H3 membership for joining hexagon data by place.
Learn more