
dismapr

dismapr provides convenient R access to NOAA’s Distribution Mapping and Analysis Portal (DisMAP) APIs, which summarize species distributions and range shifts derived from fishery-independent bottom-trawl surveys across U.S. regions.
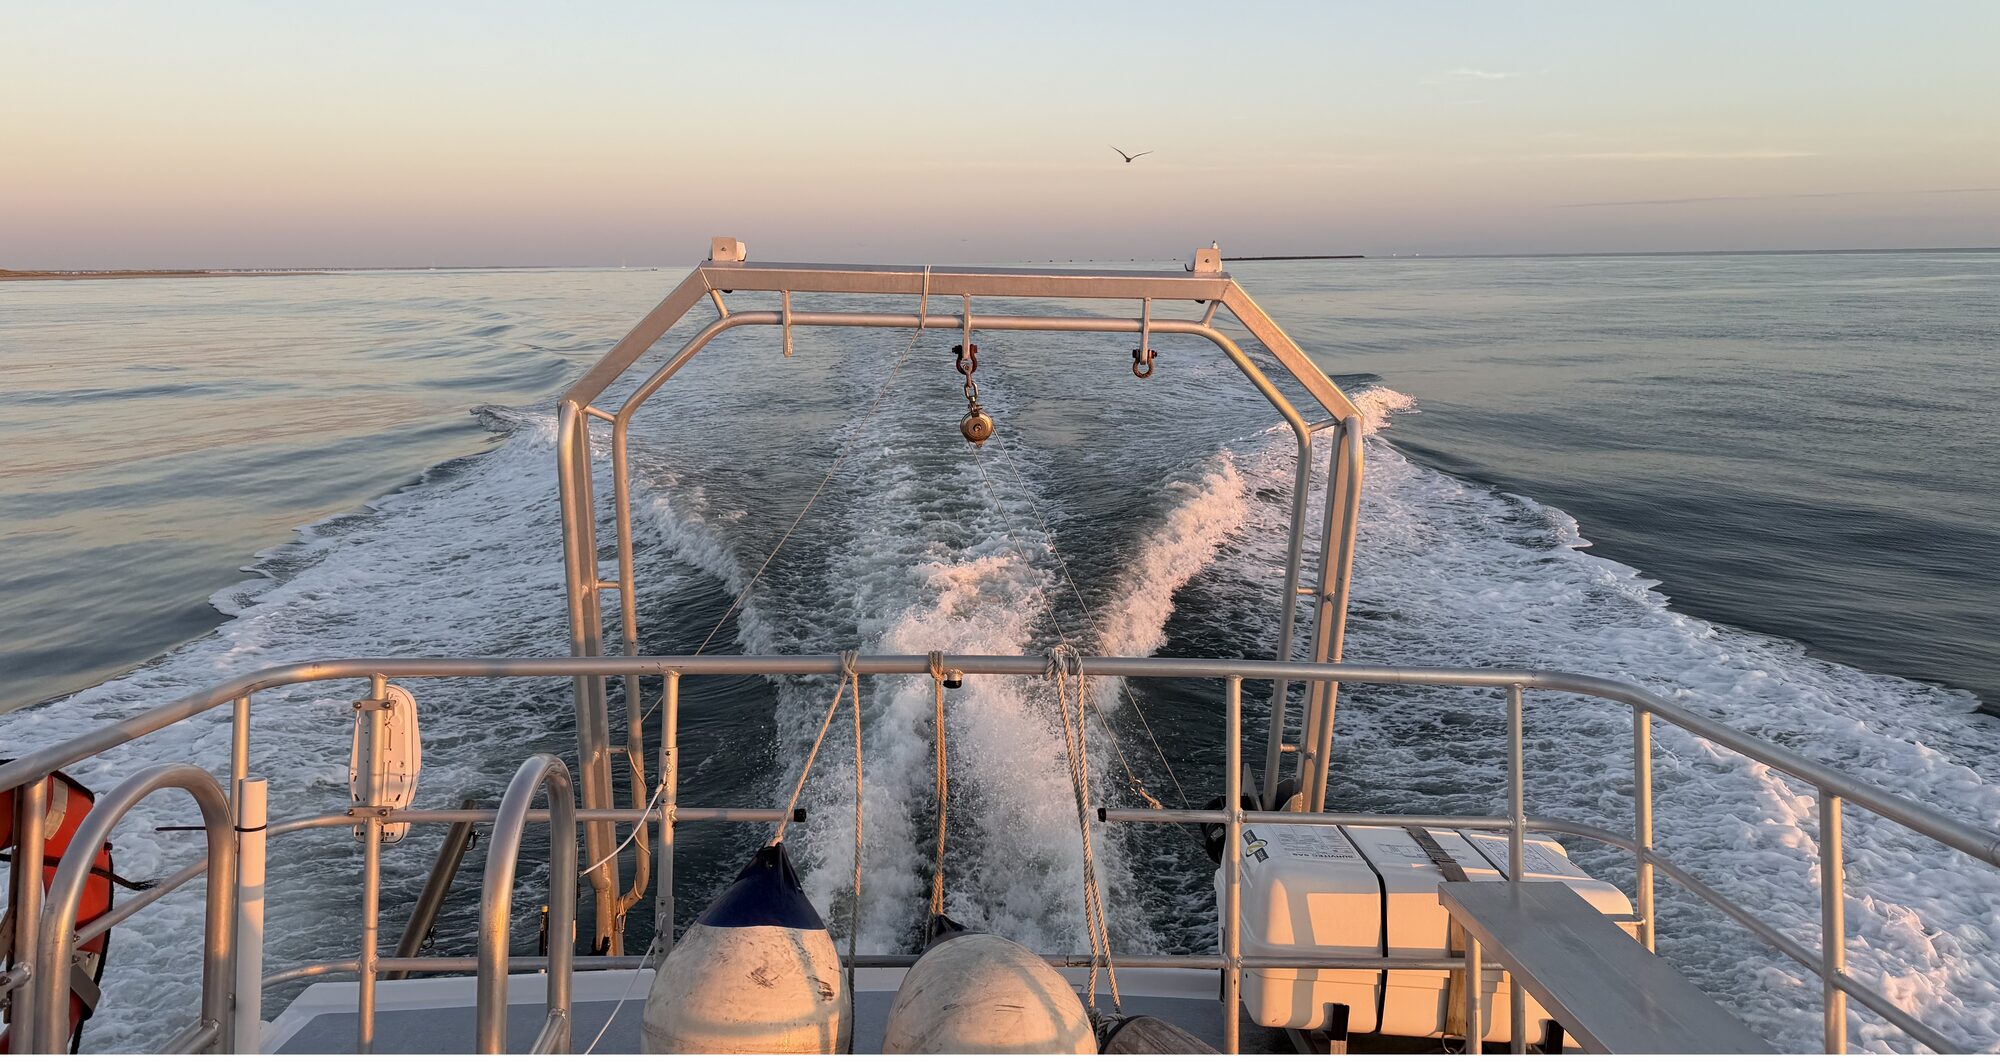
Mid-Atlantic MBON
Integrative biodiversity monitoring of a dynamic continental shelf.
Learn moreMarine Sensitivity Toolkit
A catalog and atlas of marine species distribution models and sensitivity scores for U.S. waters, harmonized with STAC-SDM into cloud-optimized GeoTIFF and GeoParquet.
Learn more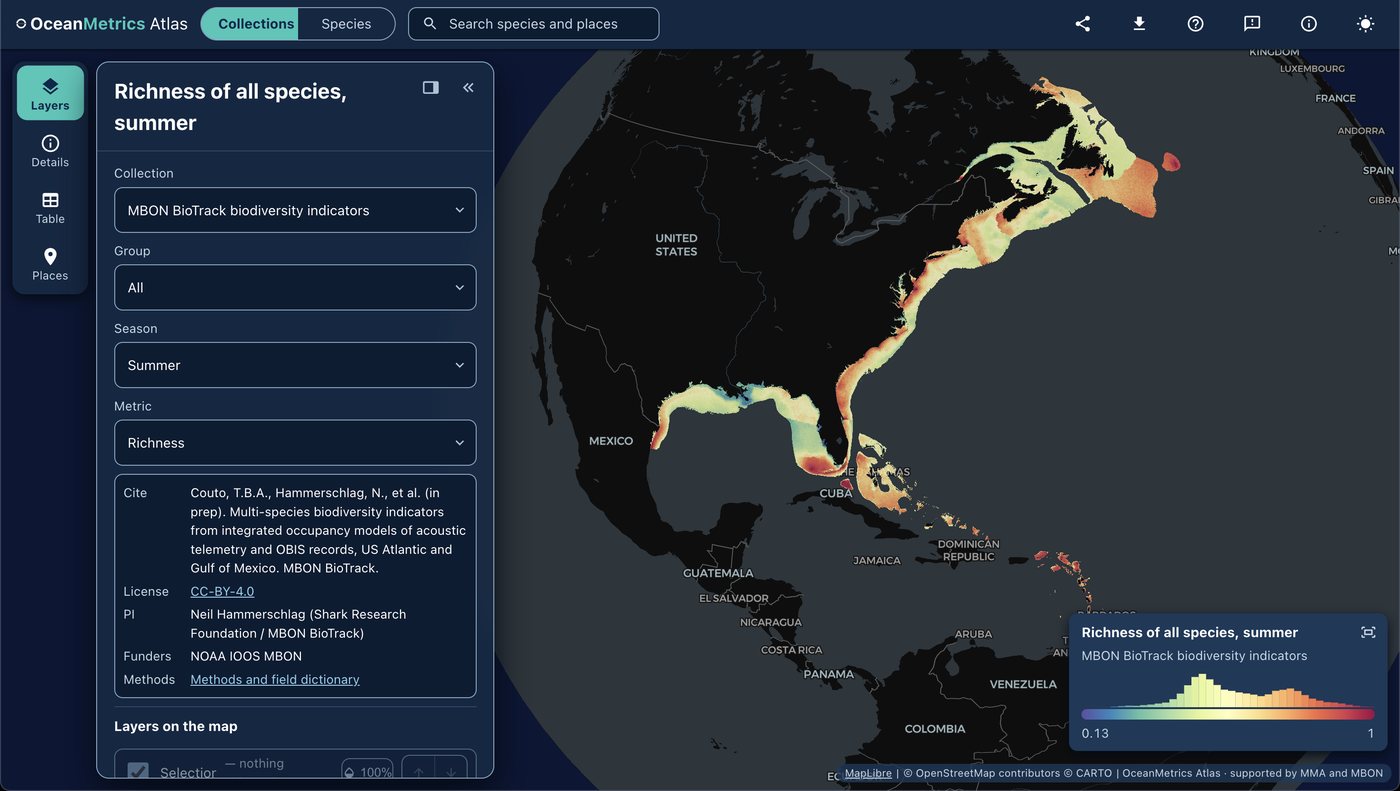
OceanMetrics Atlas
A browser map of species distribution and biodiversity model outputs, read from a STAC catalog. It opens on the AquaMaps EOV share and hosts the MBON BioTrack indicators (species richness and uncertainty from telemetry and OBIS).
Learn moreTime series of zooplankton abundance in the Florida Keys, collected by the South Florida Program (NOAA/AOML) and the Marine Biodiversity Observation Network (MBON)
Sampling is carried out bi-monthly on the R/V Walton Smith (University of Miami) as part of the South Florida Program (NOAA Atlantic Oceanographic and Meteorological Laboratory/ AOML) and the Marine Biodiversity Observation Network (MBON).
View datasetBenthic Epifauna Biomass and Abundance Data, Arctic Marine Biodiversity Observing Network (AMBON) research cruise on the Norseman II, 9 August 2015 - 3 September 2015
This dataset contains benthic epifauna biomass and abundance data collected in the Chukchi Sea, U.S. Arctic during the 9 August - 3 September 2015 Arctic Marine Biodiversity Observing Network (AMBON) research cruise aboard the vessel Norseman II.
View datasetBenthic Epifauna Biomass and Abundance Data, Arctic Marine Biodiversity Observing Network (AMBON) research cruise, August 2017
Marine biodiversity is a key component of ocean health. Monitoring and understanding marine biodiversity is essential for our ability to forecast and respond to changes.
View dataset