


Infographiq
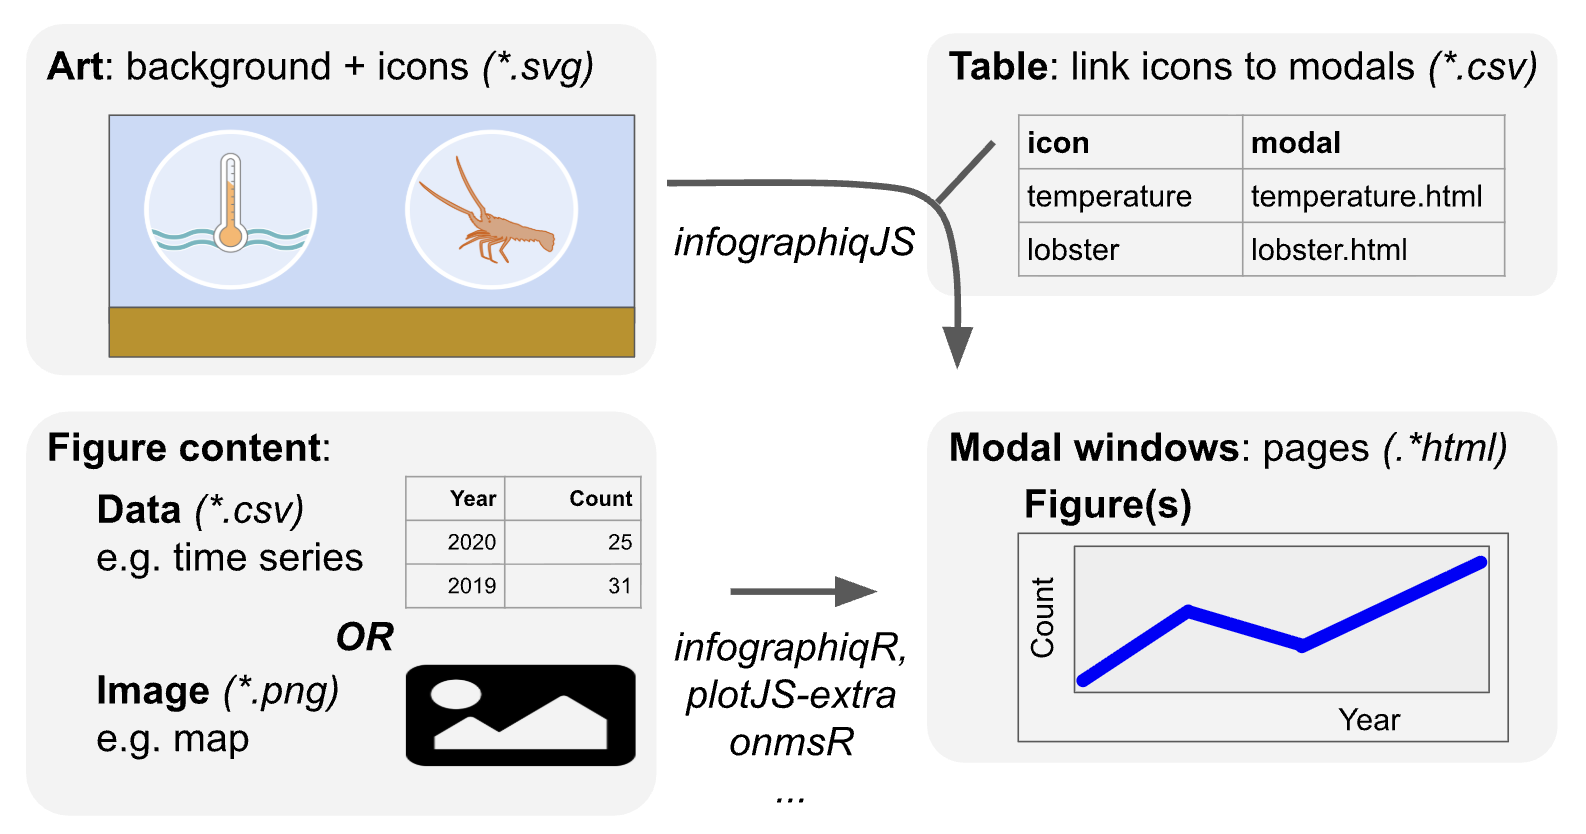
The Infographiq method uses a combination of JavaScript and R to produce clickable art that acts as an interface for users to access scientific data.
The Infographiq method uses a combination of JavaScript and R to produce clickable art that acts as an interface for users to access scientific data.
| MBON | NOAA-ONMS | NOAA-IEA | |
|---|---|---|---|
| Builders | infographiqJS | onmsR | plotJS-extra |
| (JavaScript library) | (R library) | (JavaScript library) | |
| infographiqR | |||
| (R library) | |||
| infographiq | |||
| (manual) | |||
| Instances | Channel Islands NMS | Florida Keys NMS | |
| Olympic Coast NMS | Alaska IEA | ||
| Sound Monitoring | Responsive Tables |