
Sanctuaries Climate Dashboard
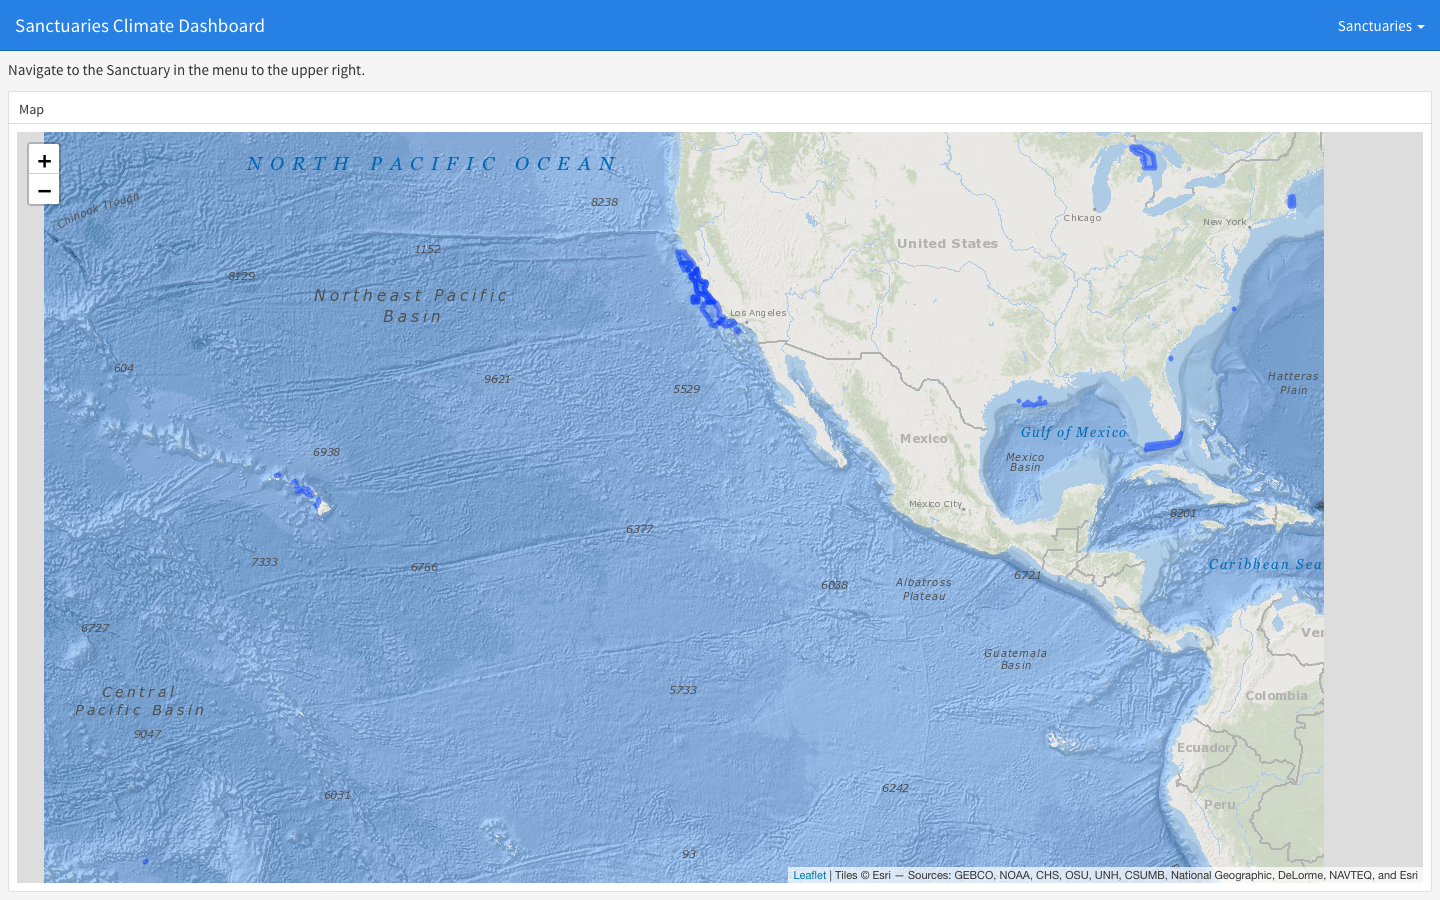
A flexdashboard-based product that renders climate indicators for each National Marine Sanctuary as a static website hosted on GitHub Pages. The layout follows ecowatch.noaa.gov and supports panels for bottom temperature, sea surface temperature, pH, precipitation, and sea-level rise among others. The dashboard is regenerated on a schedule by pulling from ERDDAP and Copernicus Marine Service endpoints.
The dashboard’s principal strength is durability: a static site has no runtime dependencies, no database to corrupt, and costs effectively nothing to host. For interactive exploration — swipeable maps, custom date ranges — see the companion Climate Change for Sanctuaries Shiny application.
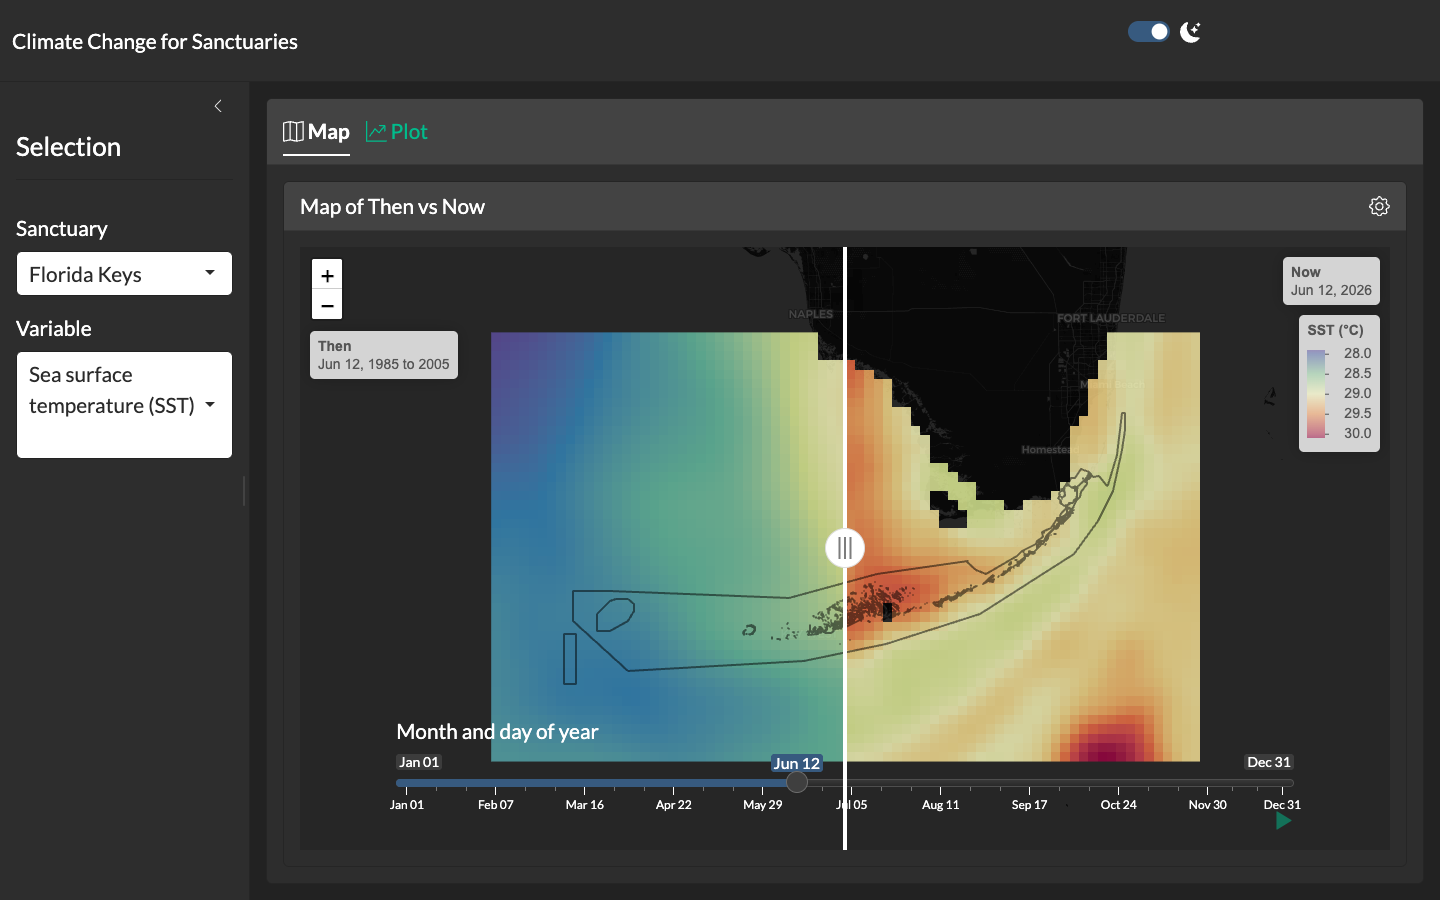
Climate Change for Sanctuaries
Shiny application with a swipeable "then vs. now" map comparing climatological reference periods to the present for each U.S. National Marine Sanctuary.
Learn more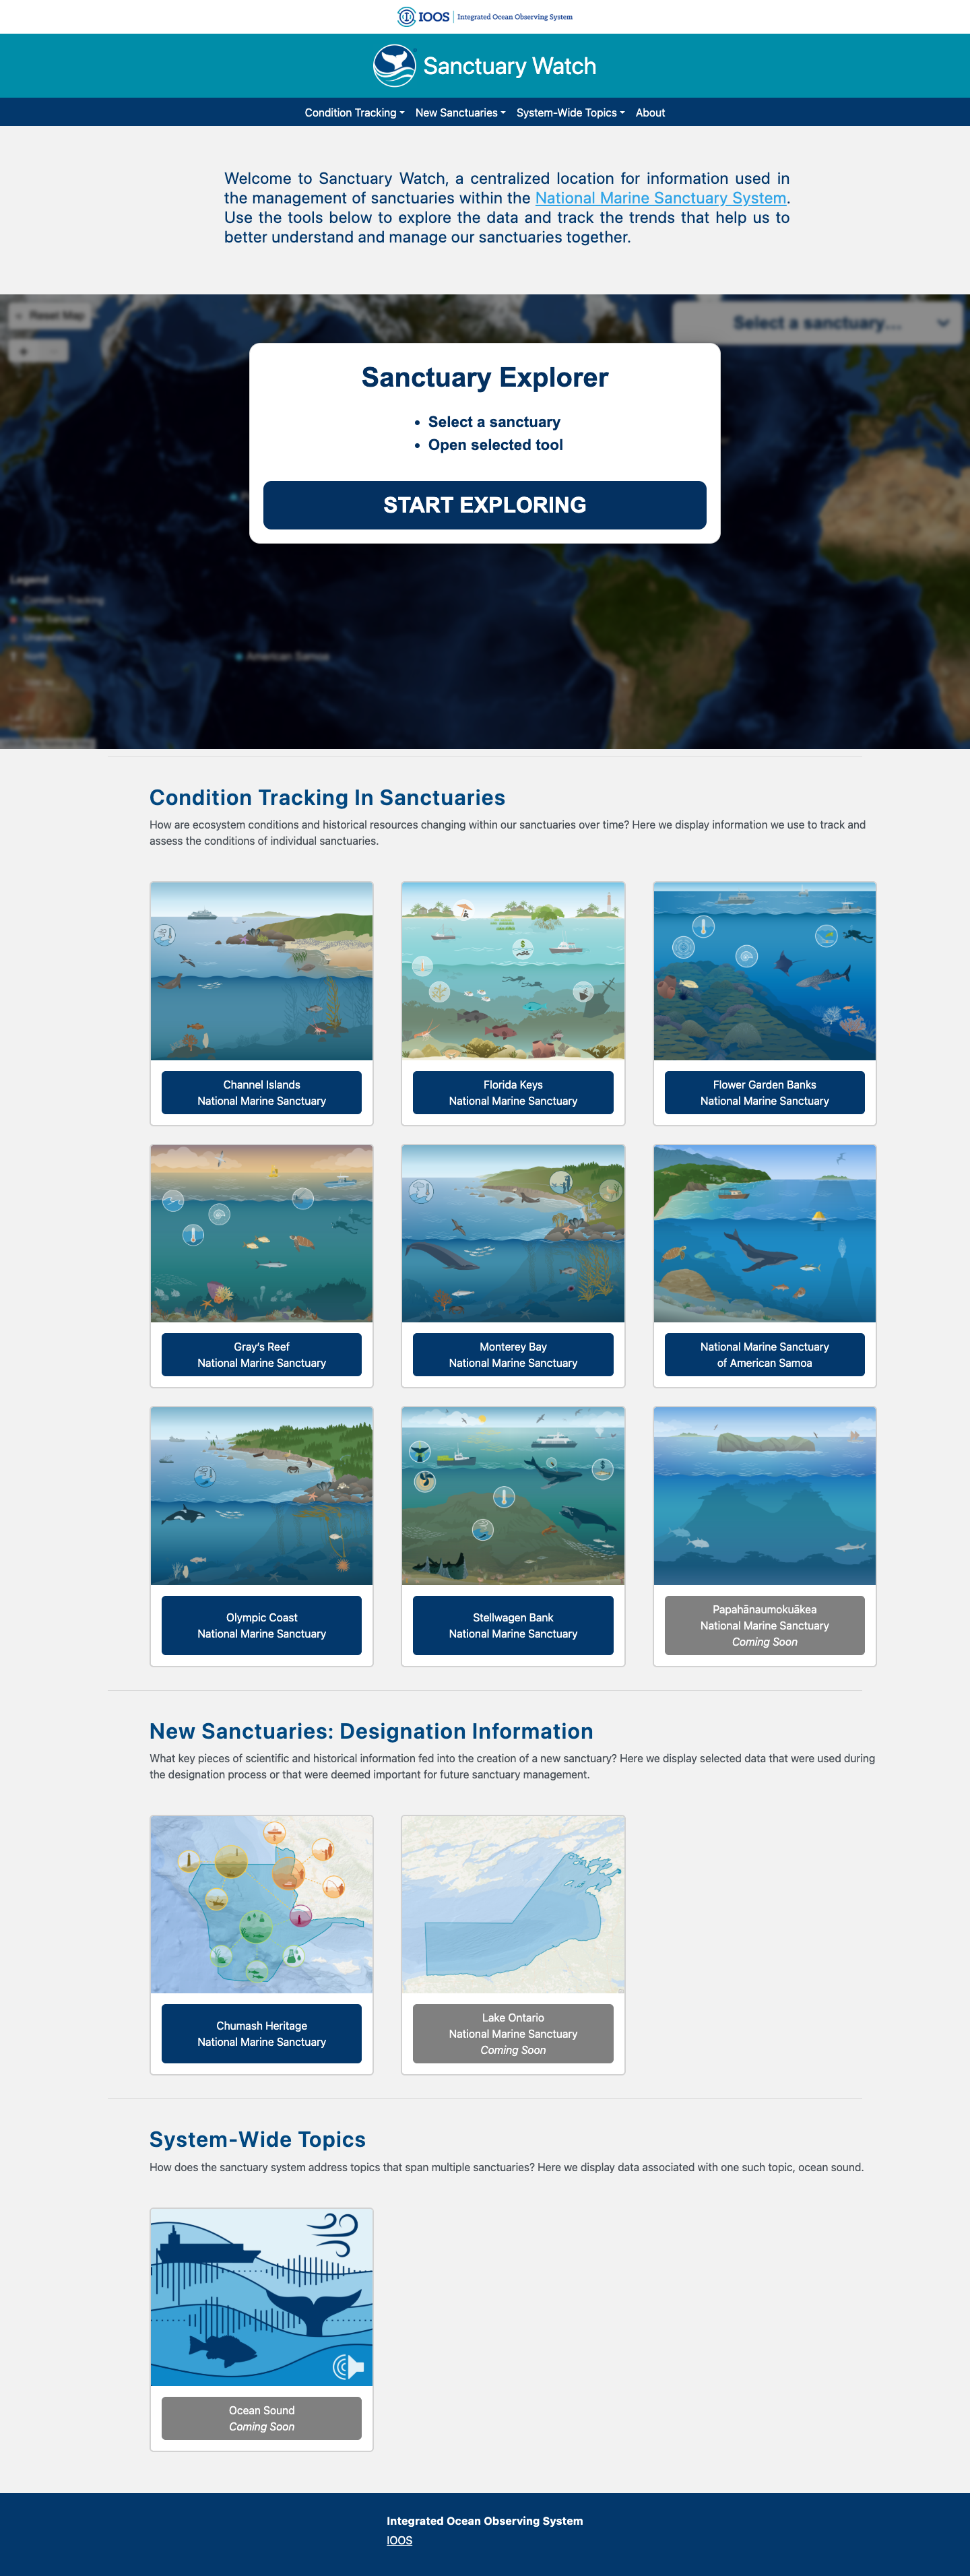
Sanctuary Watch
Web-based interactive tools for tracking ecosystem conditions, human connections, and management impacts across U.S. National Marine Sanctuaries.
Learn more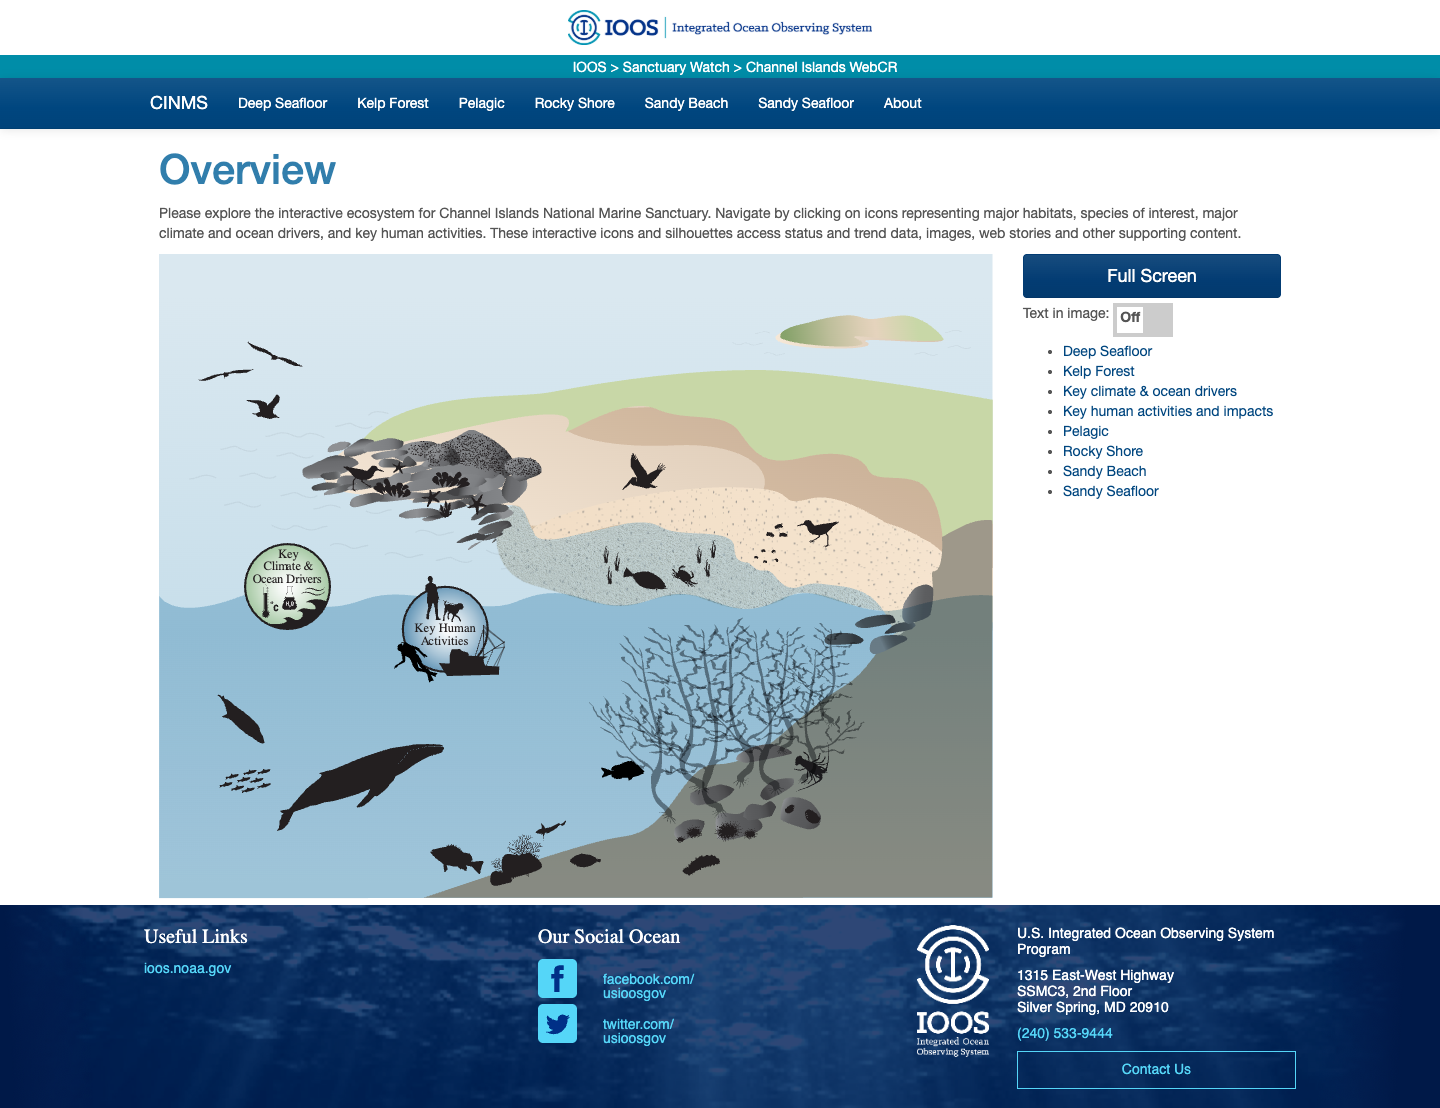
CINMS Infographics
Interactive ecosystem infographics for Channel Islands National Marine Sanctuary.
Learn more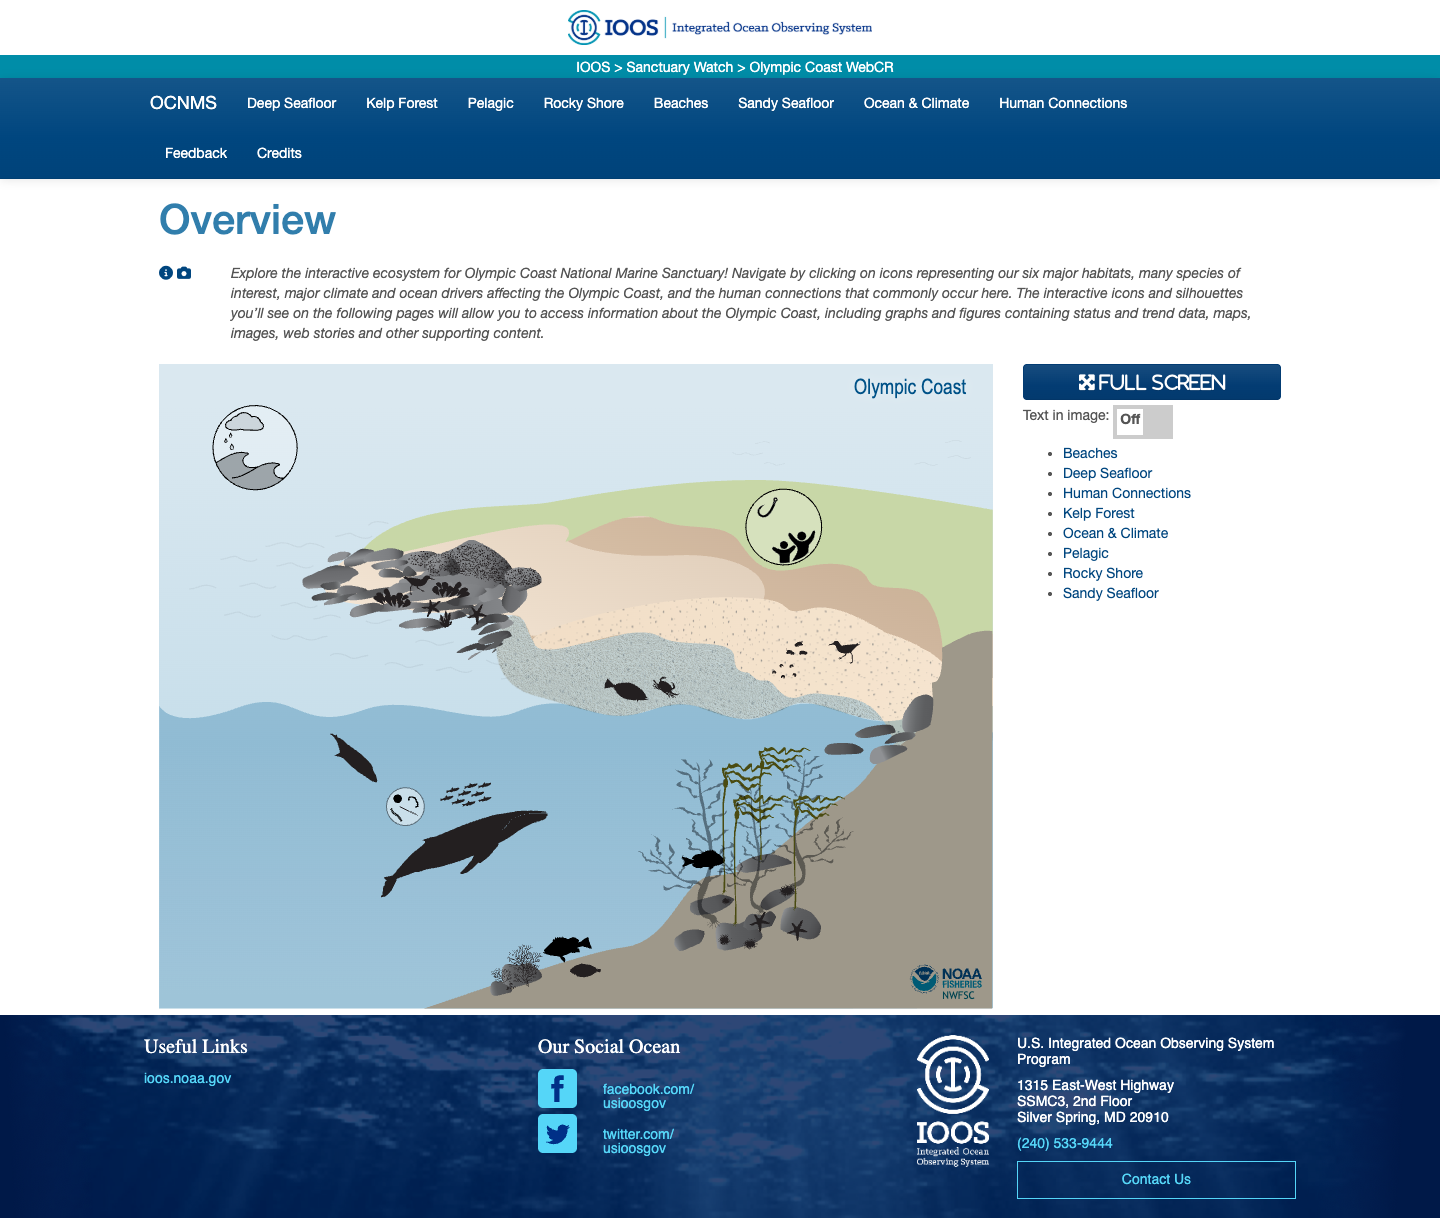
Olympic Coast NMS Infographics
Interactive ecosystem infographics for the Olympic Coast National Marine Sanctuary.
Learn more
Southeast US MBON
Southeastern United States, integrating fieldwork and satellite observations.
Learn more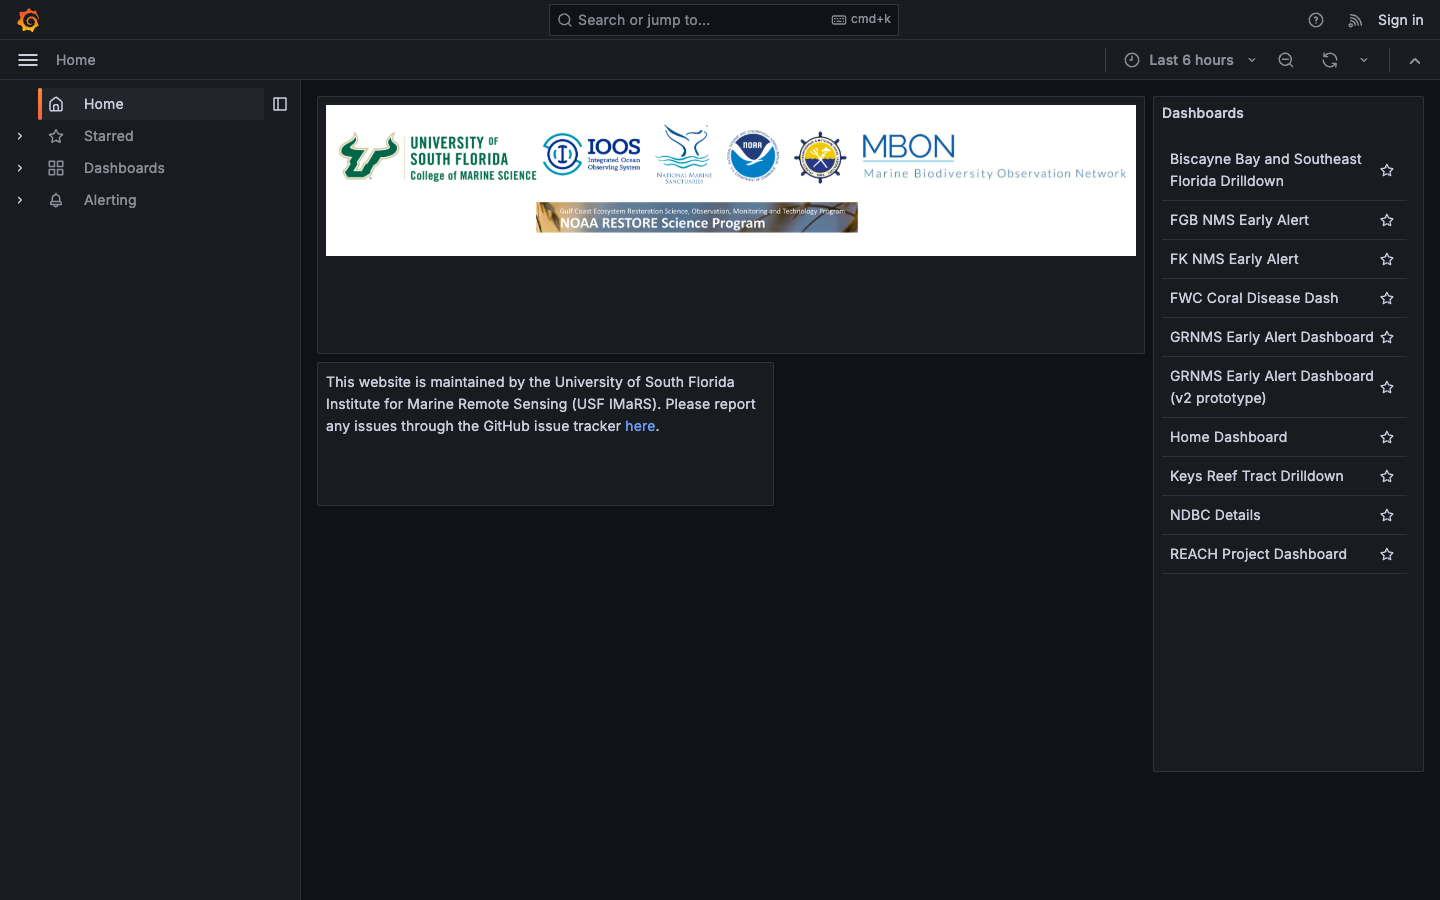
Florida Keys NMS Alert Dashboard
Early-warning dashboard combining satellite and buoy data to detect harmful algal blooms and anoxic conditions in the Florida Keys National Marine Sanctuary.
Learn more