
Climate Change for Sanctuaries
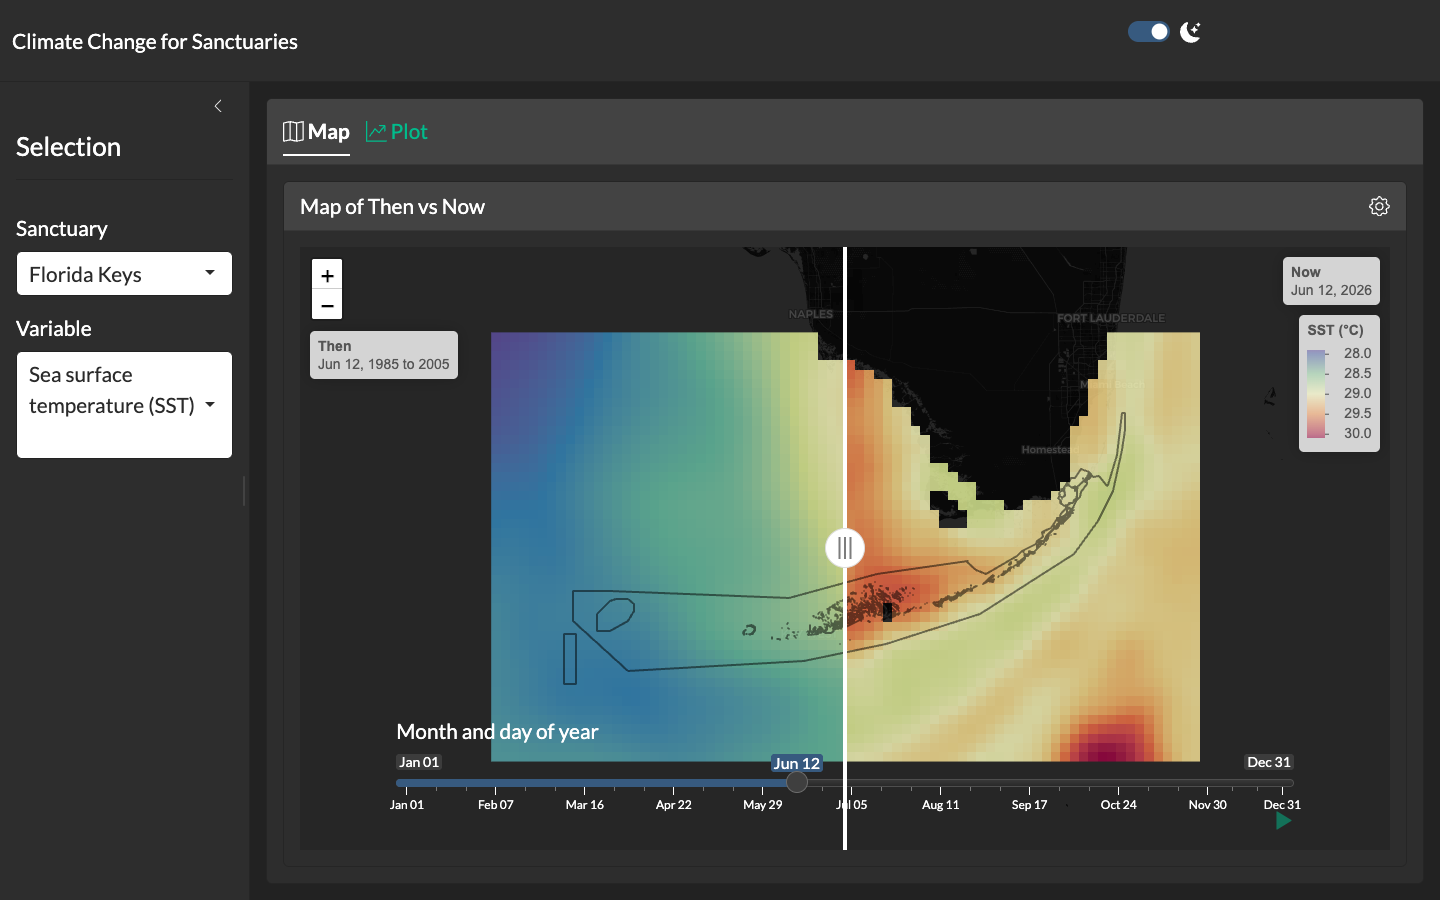
Extends the static Sanctuaries Climate Dashboard with an interactive Shiny interface. The signature view is a swipeable map comparing climatological “then” (1985–2005 reference) to “now” (most recent day-of-year) for each sanctuary; a lower slider steps the comparison through the calendar year. Sanctuary and variable are selectable from the left-hand panel.
The application is packaged as a Docker Compose stack and runs alongside the static dashboard so each absorbs the load it’s best suited for: the static site survives Shiny server downtime, while the Shiny app provides exploration where needed. The same ingestion pipeline feeds the noaa-onms/eco-indicators repository (Copernicus for Sanctuaries), from which derived indicators are generated at monthly cadence.
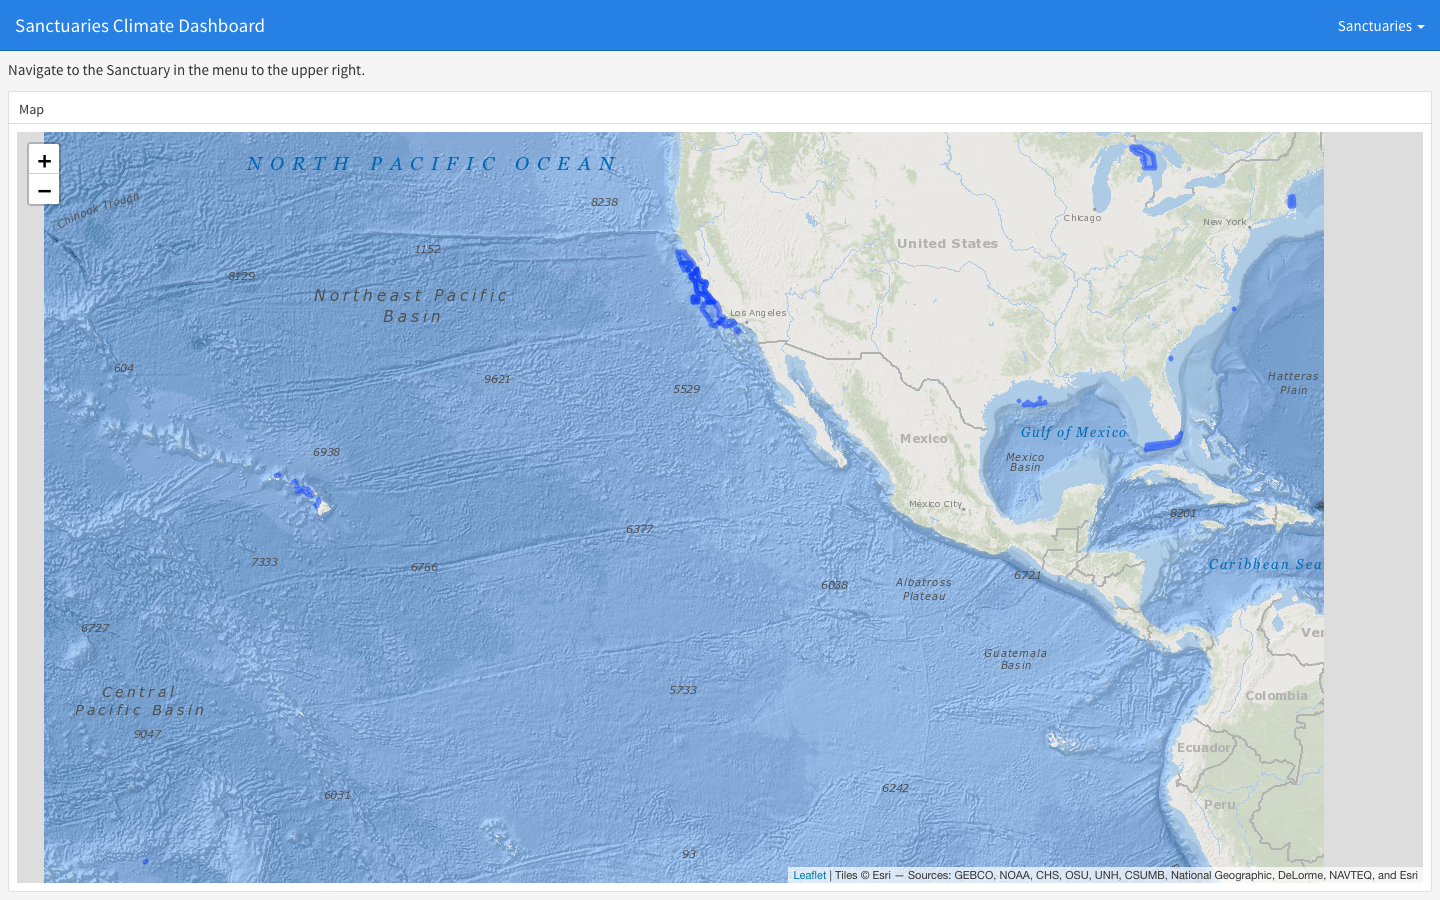
Sanctuaries Climate Dashboard
Static flexdashboard rendering climate indicators — sea surface temperature, chlorophyll-a, pH, sea-level rise — for each U.S. National Marine Sanctuary.
Learn more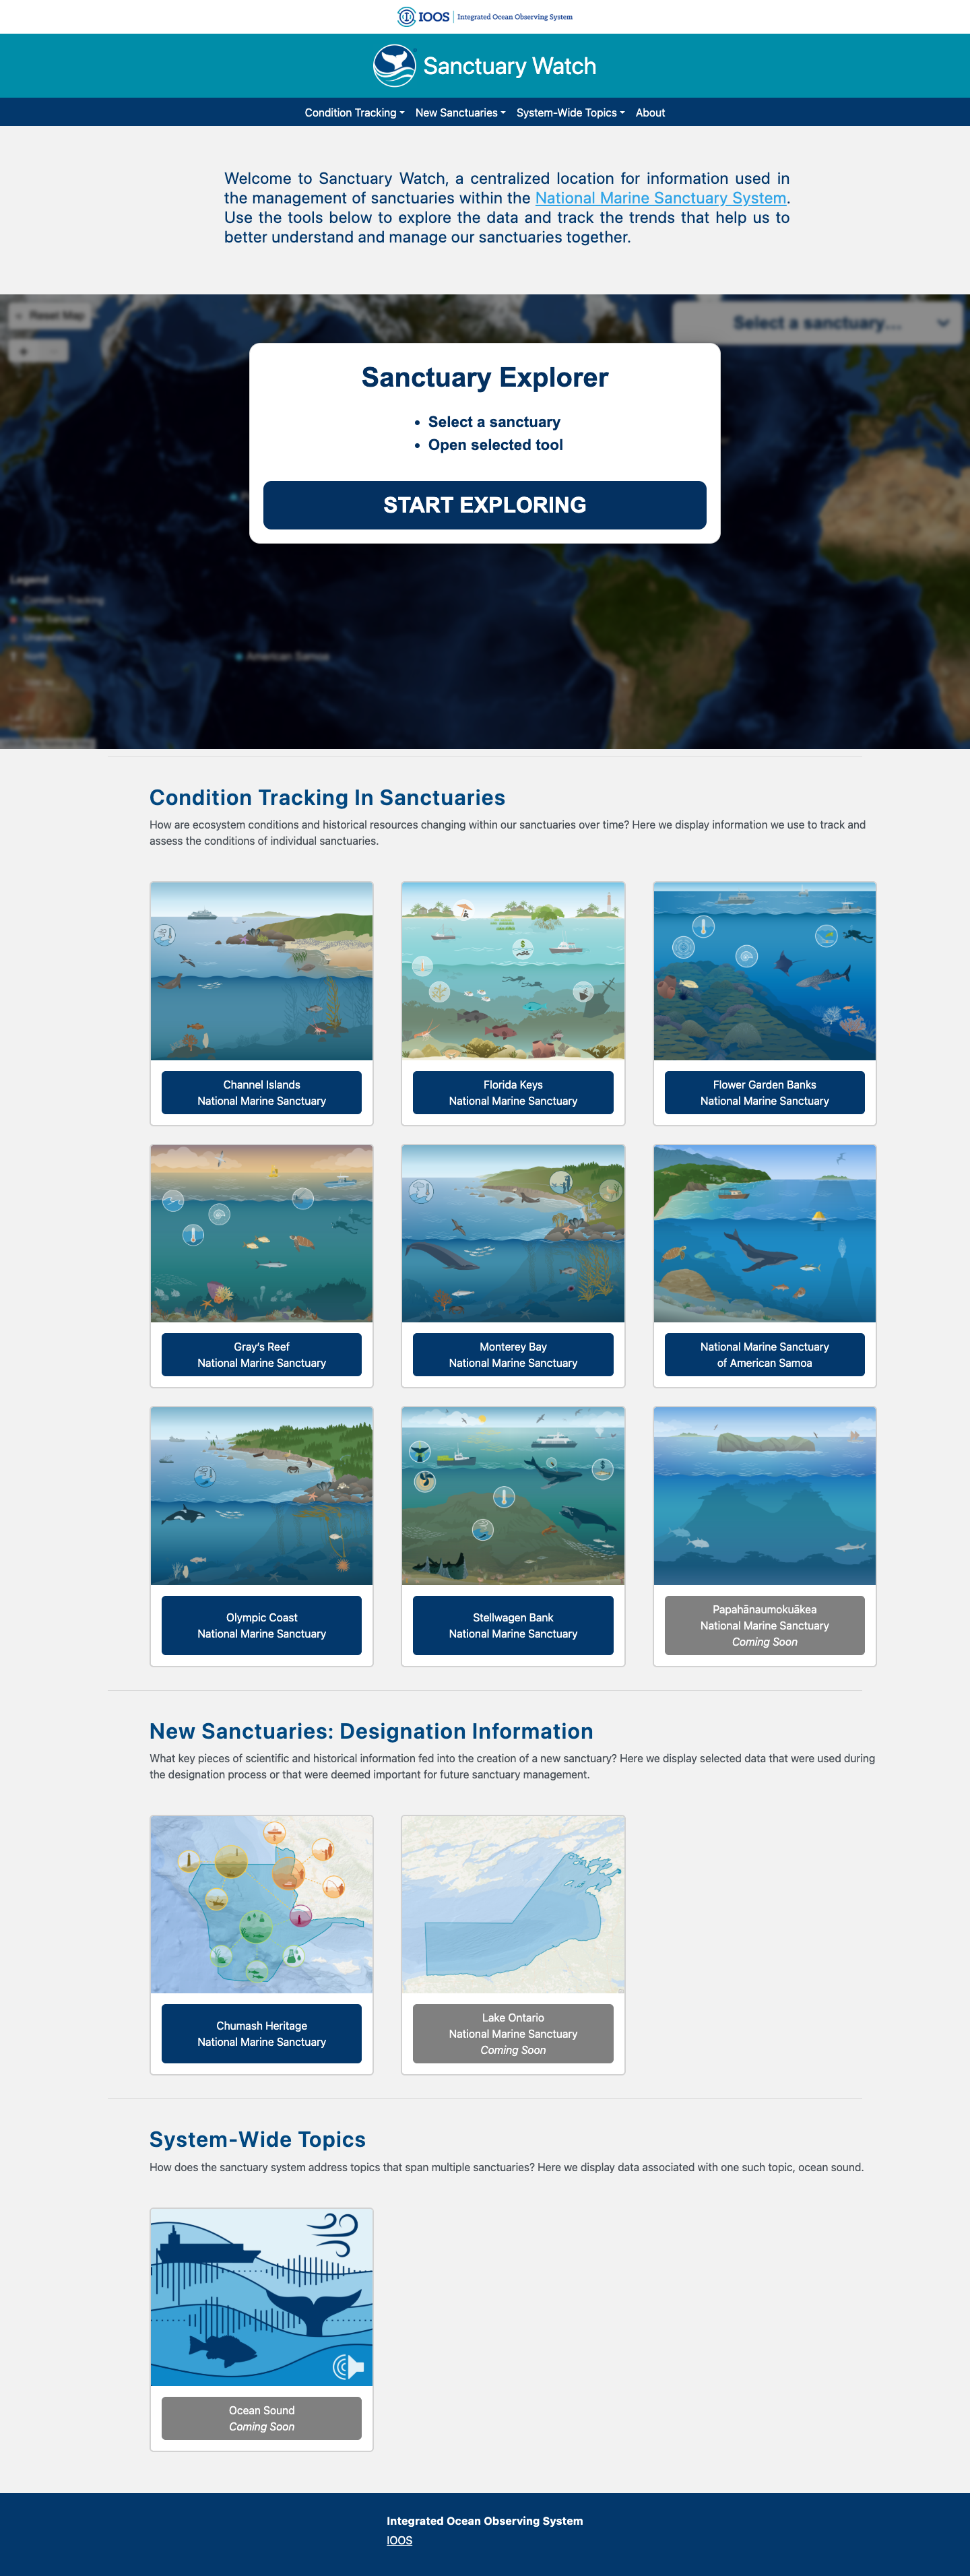
Sanctuary Watch
Web-based interactive tools for tracking ecosystem conditions, human connections, and management impacts across U.S. National Marine Sanctuaries.
Learn more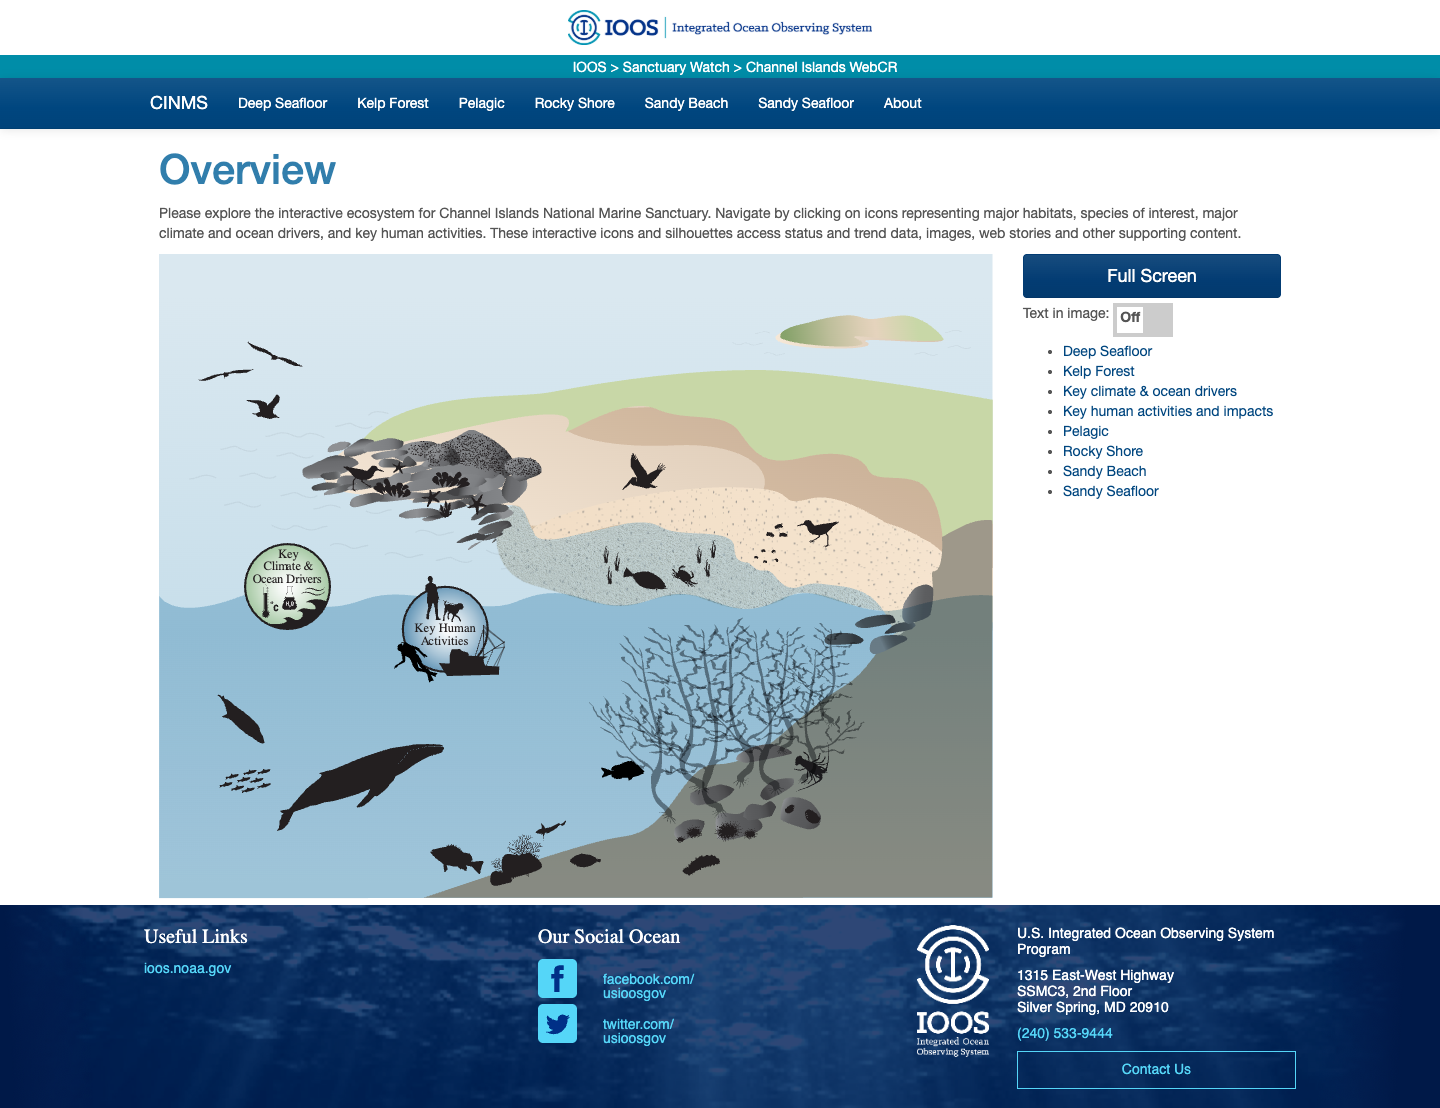
CINMS Infographics
Interactive ecosystem infographics for Channel Islands National Marine Sanctuary.
Learn more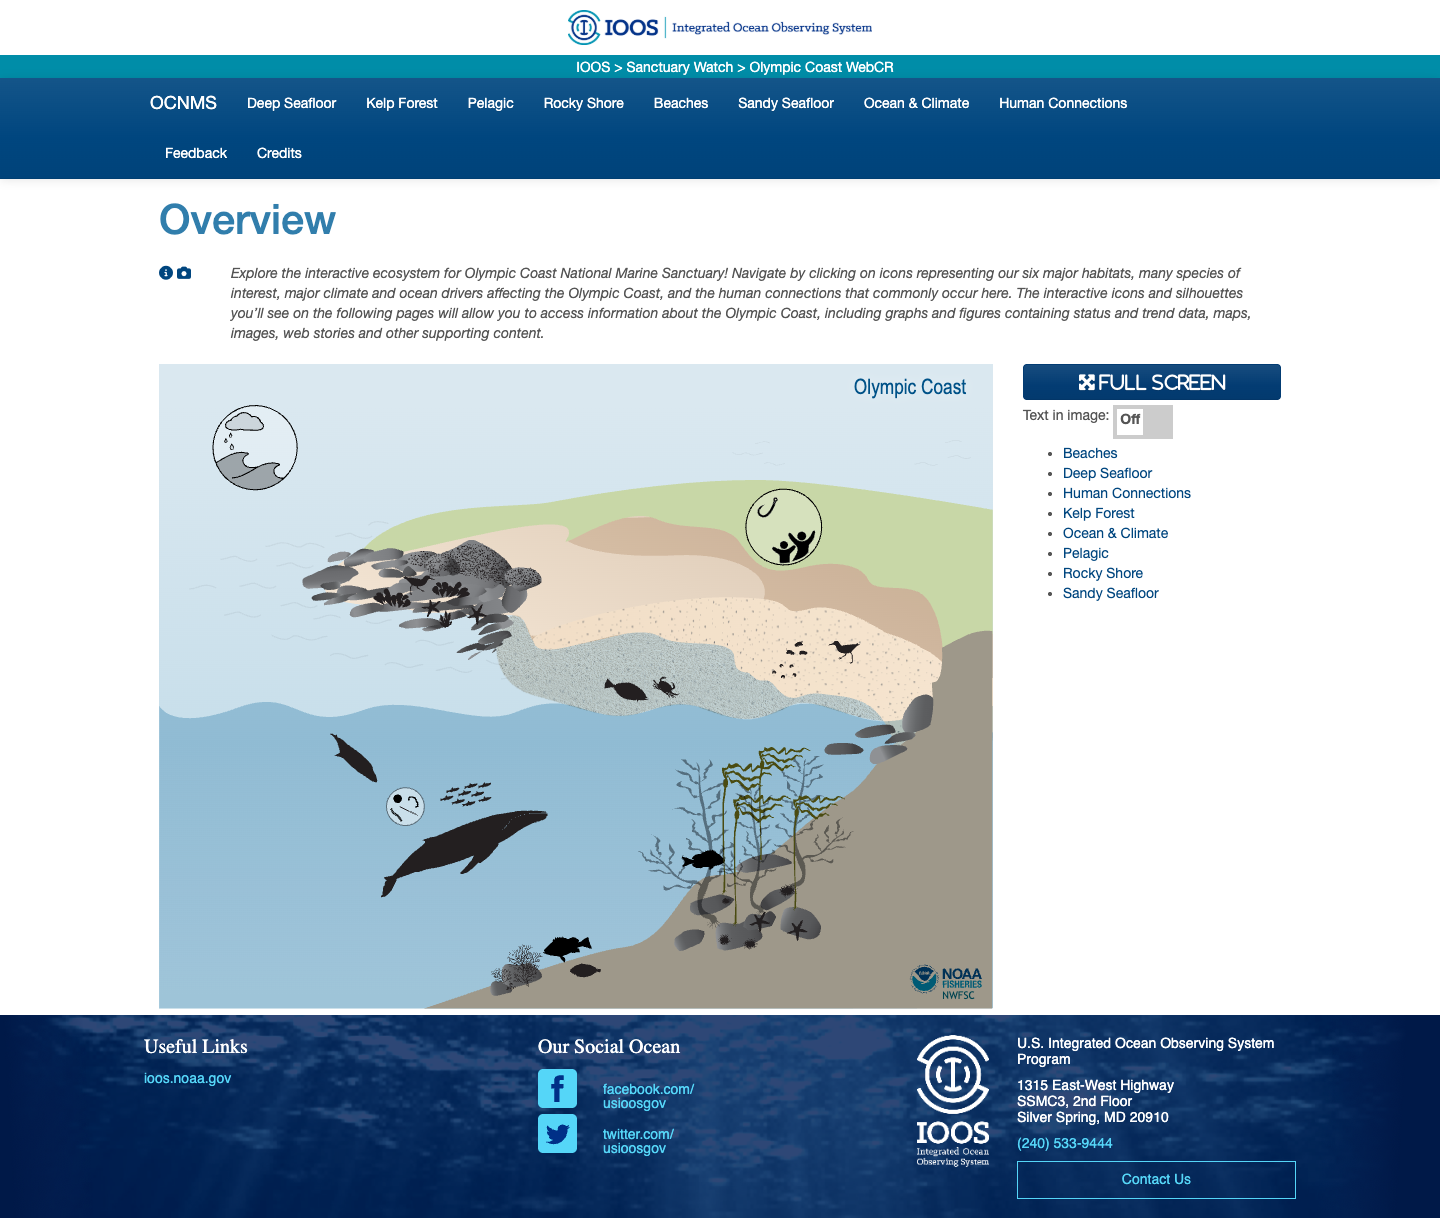
Olympic Coast NMS Infographics
Interactive ecosystem infographics for the Olympic Coast National Marine Sanctuary.
Learn more
Southeast US MBON
Southeastern United States, integrating fieldwork and satellite observations.
Learn more
Florida Keys NMS Alert Dashboard
Early-warning dashboard combining satellite and buoy data to detect harmful algal blooms and anoxic conditions in the Florida Keys National Marine Sanctuary.
Learn more