
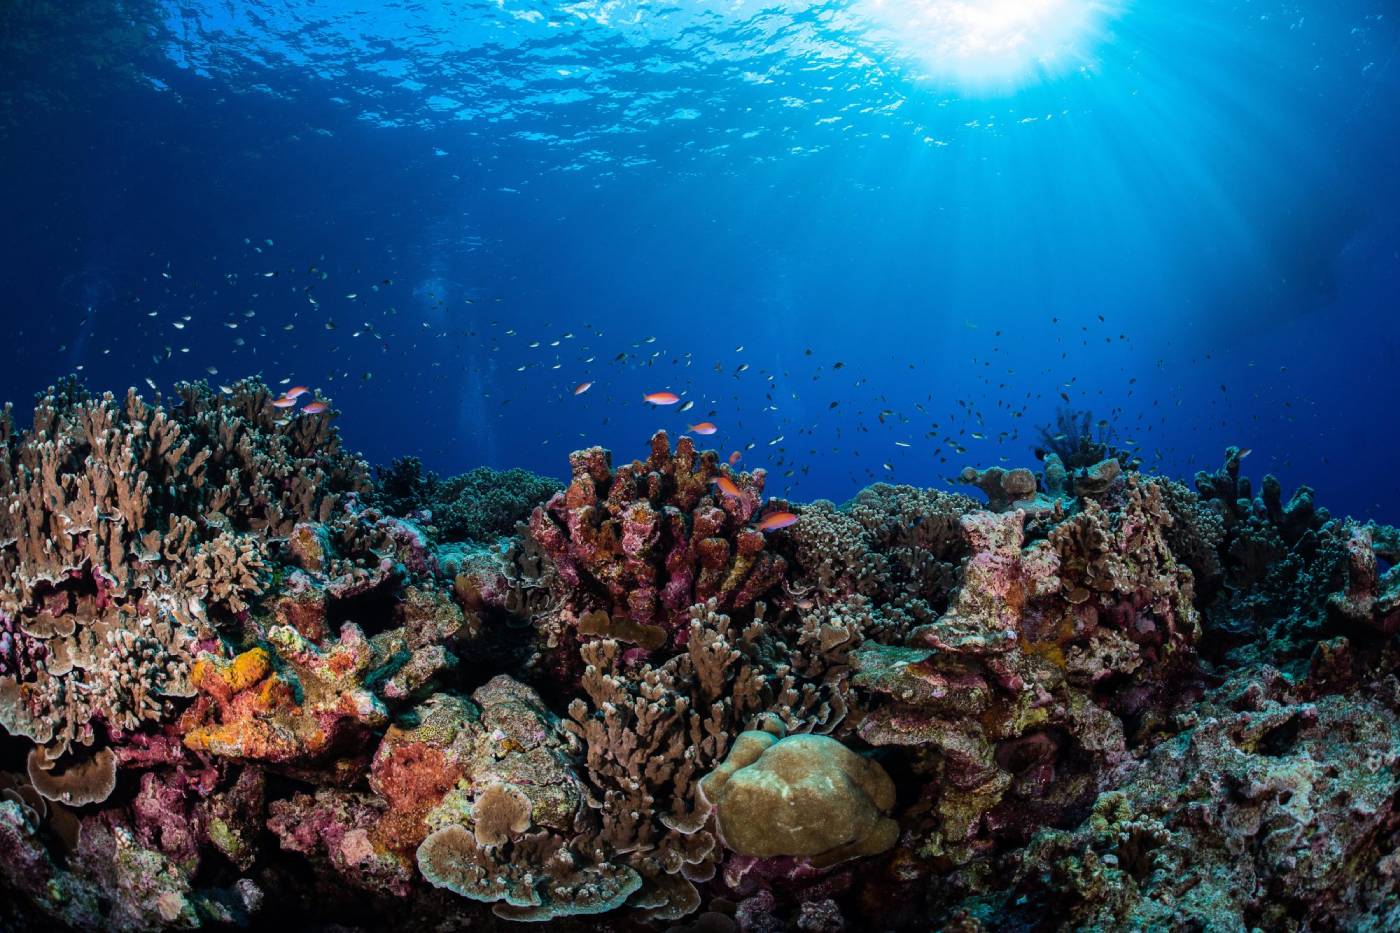
Observing life in the sea, across instruments and the globe
MBON integrates long-term programs into a connected, open and interoperable record of marine biodiversity — turning observations into products that inform conservation and policy worldwide.
Methods for a connected ocean record
MBON advances modern observing approaches — from satellite pixels to single molecules of DNA — extending traditional surveys across space and time. Hover any hotspot to learn more.
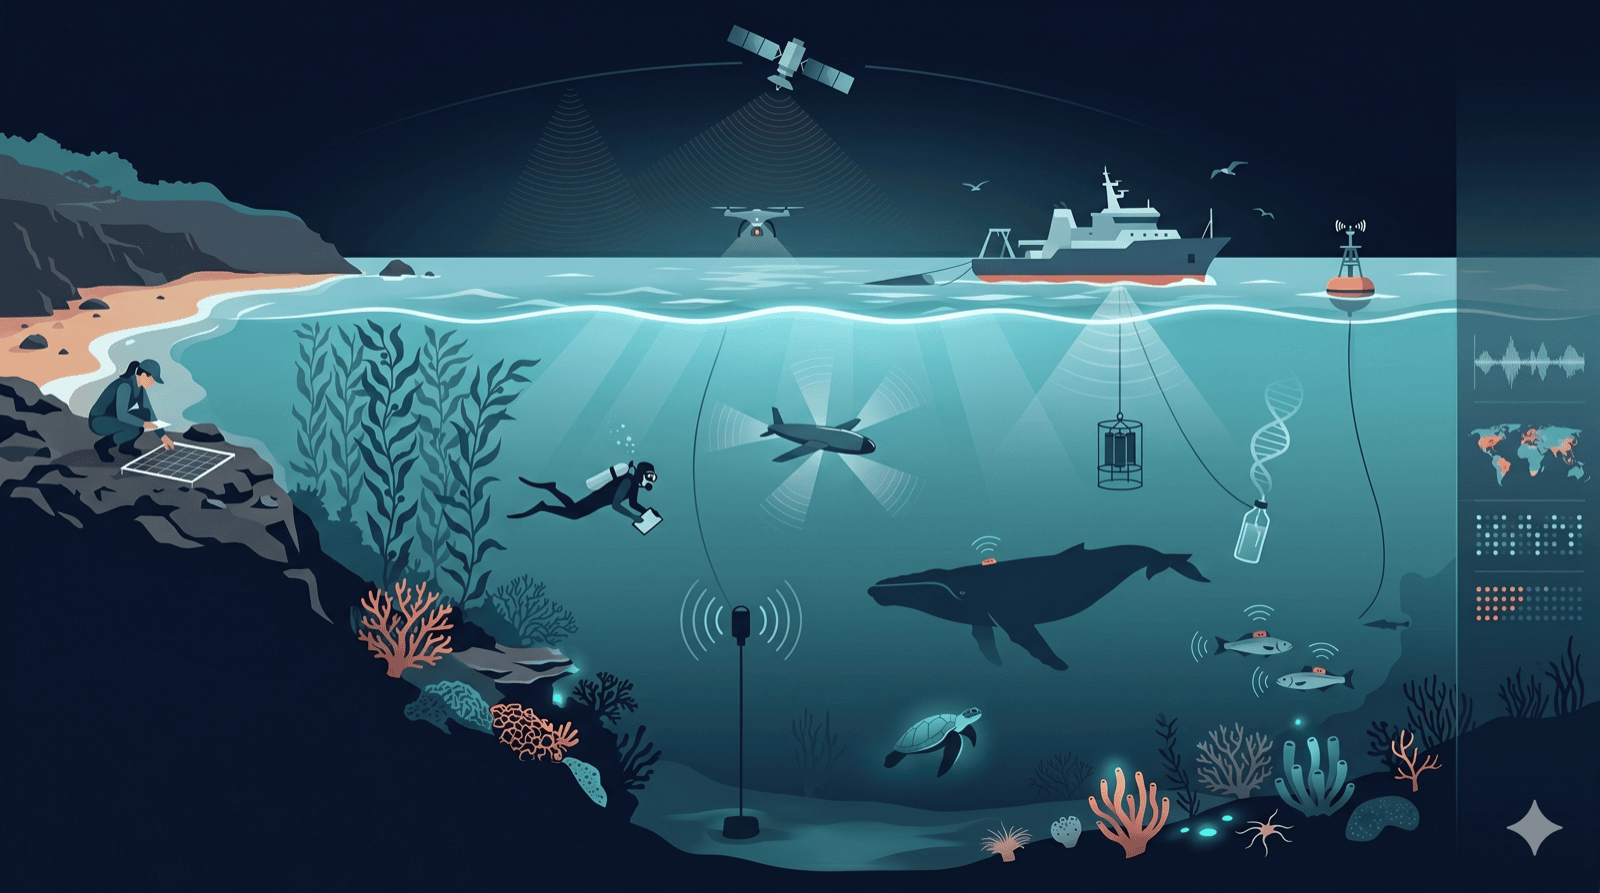
Satellites and aerial sensors map ocean color, sea surface temperature, and habitat extent across millions of square kilometers — resolving patterns no ship survey could match at that scale. Seascapes products blend multi-sensor imagery into dynamic biodiversity indicators.
Learn moreRocky-shore and sandy-beach transects, photo quadrats, and intertidal surveys record coastal biodiversity — from barnacles and algae to shorebirds — using standardized protocols that make observations comparable across ocean basins.
Learn moreTrawl surveys, visual transects, and ship-based acoustic surveys remain the calibration backbone for modern methods. They are labor-intensive and costly at large scale — which is exactly why MBON invests in genomic, acoustic, and remote-sensing approaches that can extend coverage between cruises.
Learn morePassive acoustic monitoring (PAM) listens for biological and anthropogenic sound to infer biodiversity and ecosystem health. Active acoustics (echosounders, ADCPs) enumerate fish and zooplankton biomass, covering the water column continuously, day and night.
Learn moreElectronic tags on fish, turtles, marine mammals, and seabirds record fine-scale movements, diving behavior, and physiology. Acoustic and satellite telemetry build 3-D pictures of how animals use ocean habitat — essential for understanding connectivity and response to climate change.
Learn moreWater and sediment samples contain DNA shed by every organism that passed through. Metabarcoding and metagenomics decode this environmental DNA to produce species inventories from a single water bottle — faster and cheaper than visual surveys for many taxa.
Learn moreRaw observations become decision-relevant information through synthesis into Essential Ocean Variables and Essential Biodiversity Variables. MBON's indicators and data-management working groups build reproducible pipelines that flow from every node into OBIS and the global biodiversity knowledge graph (FAIR data).
Learn moreRegional nodes from the US and worldwide
Click on an MBON node — or drag to spin the globe.


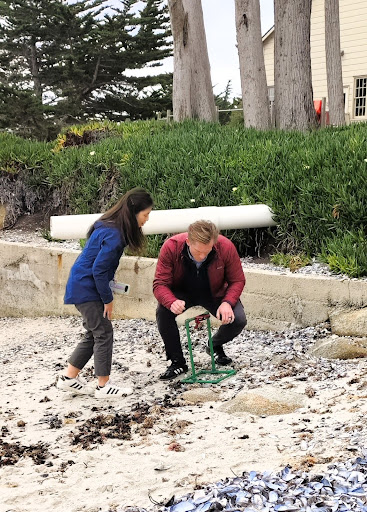
User Story: Bringing Steinbeck & Ricketts into the MBON Era
Over 85 years after Steinbeck and Ricketts documented life in the Sea of Cortez tidepools, a binational team retraces their expedition using MBON Pole-to-Pole protocols and eDNA to measure decades of biodiversity change.
Read story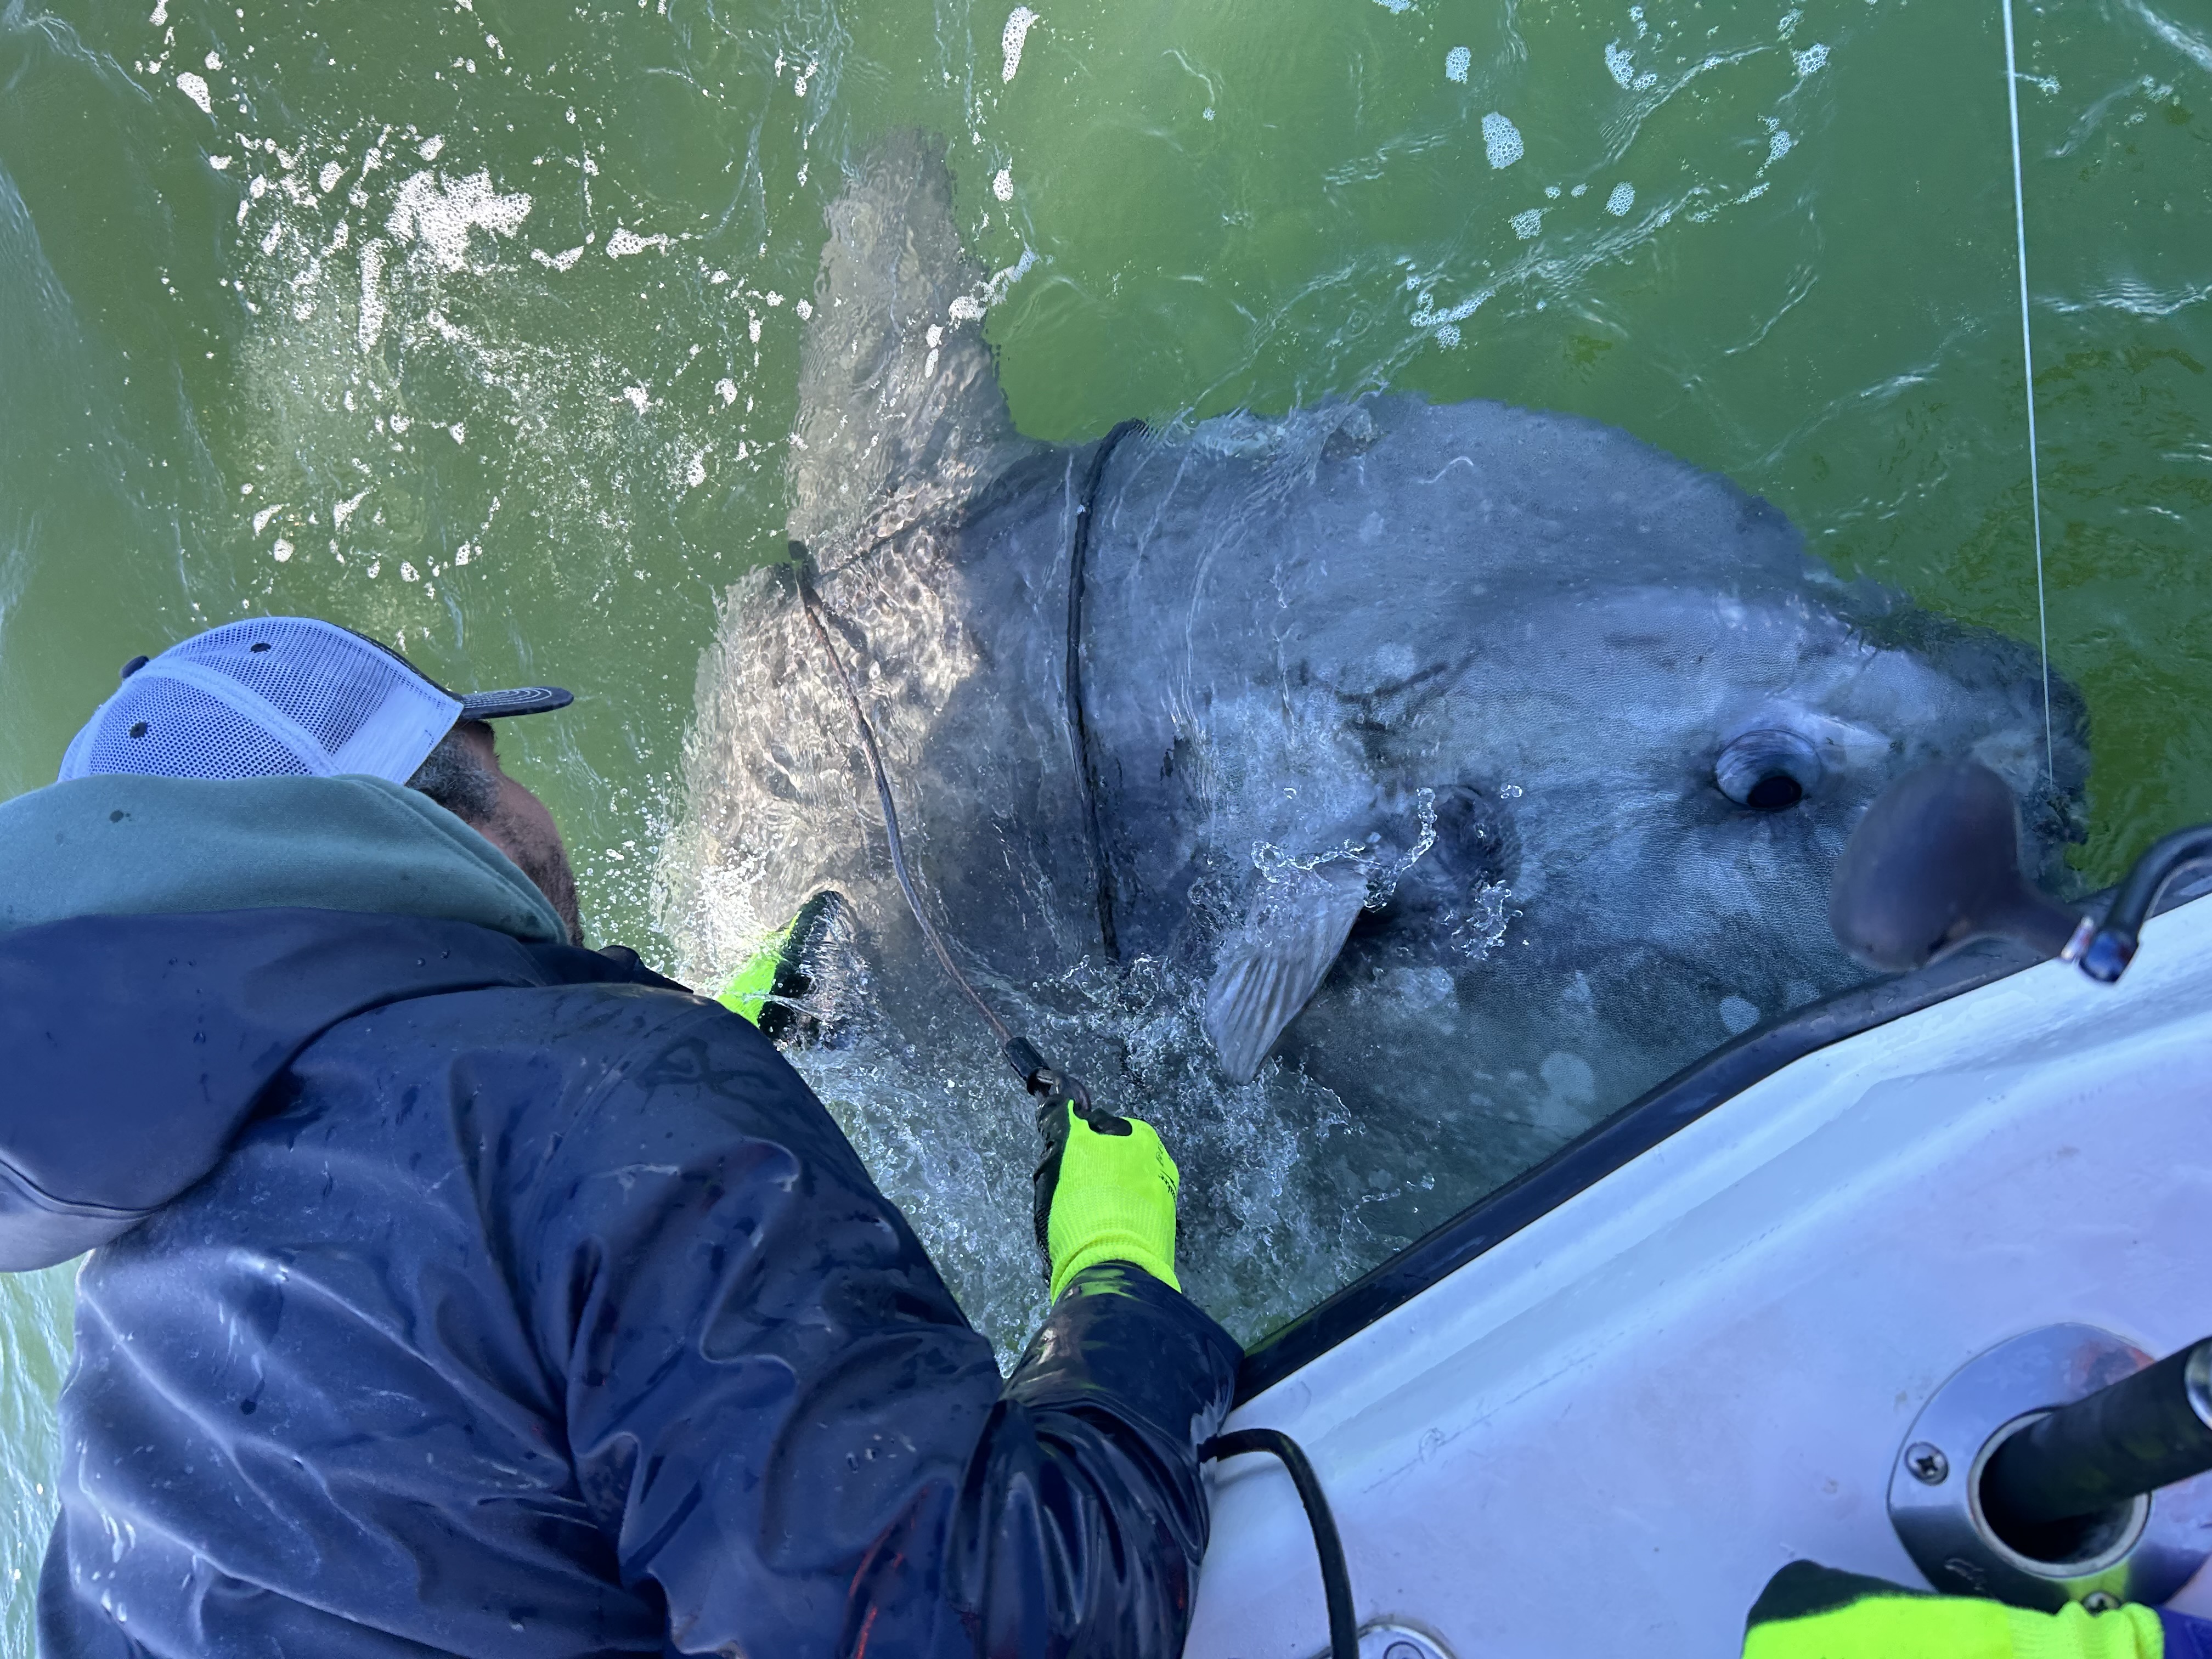
Tracking Ocean Sunfish to Map Marine Biodiversity Hotspots
By combining satellite and acoustic tracking of marine species like the ocean sunfish, BioTrack is uncovering key patterns in biodiversity and making animal-movement data accessible to resource managers.
Read story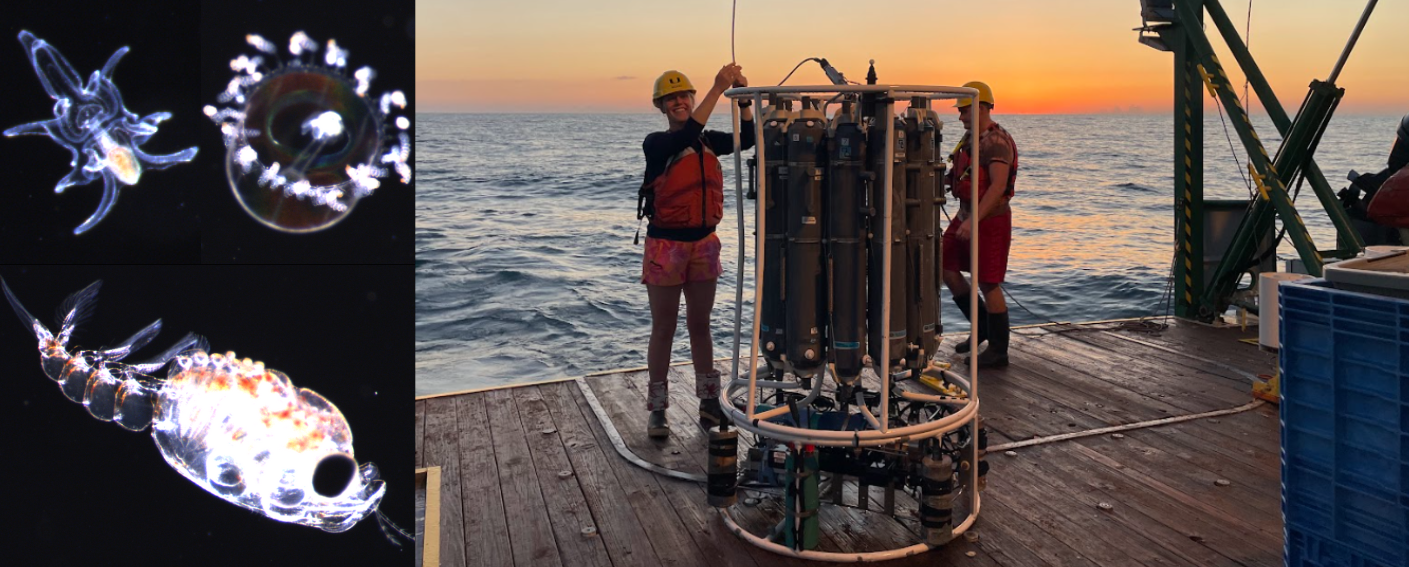
Plankton Perfect: Using Imagery to Document Microscopic Marine Life
Dr. Enrique Montes uses a CPICS underwater microscope to capture high-resolution images of plankton in South Florida waters, building a new window into marine biodiversity.
Read storyTurning observations into decisions
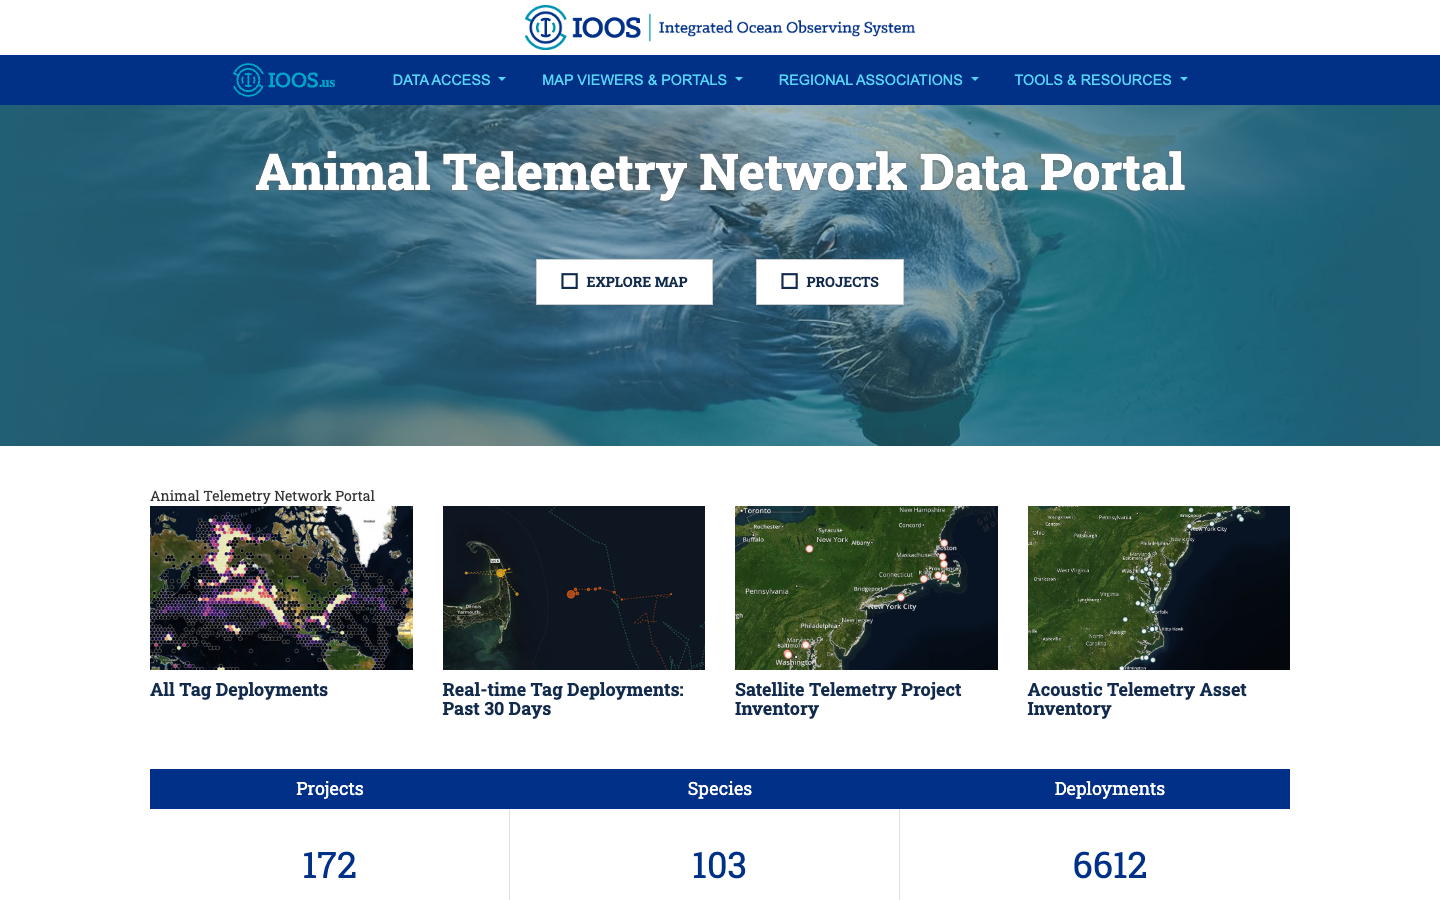
BioTrack Telemetry Portal
Interactive map of satellite and acoustic marine animal tracks that identifies biodiversity hotspots and their overlap with human-use areas.
Learn more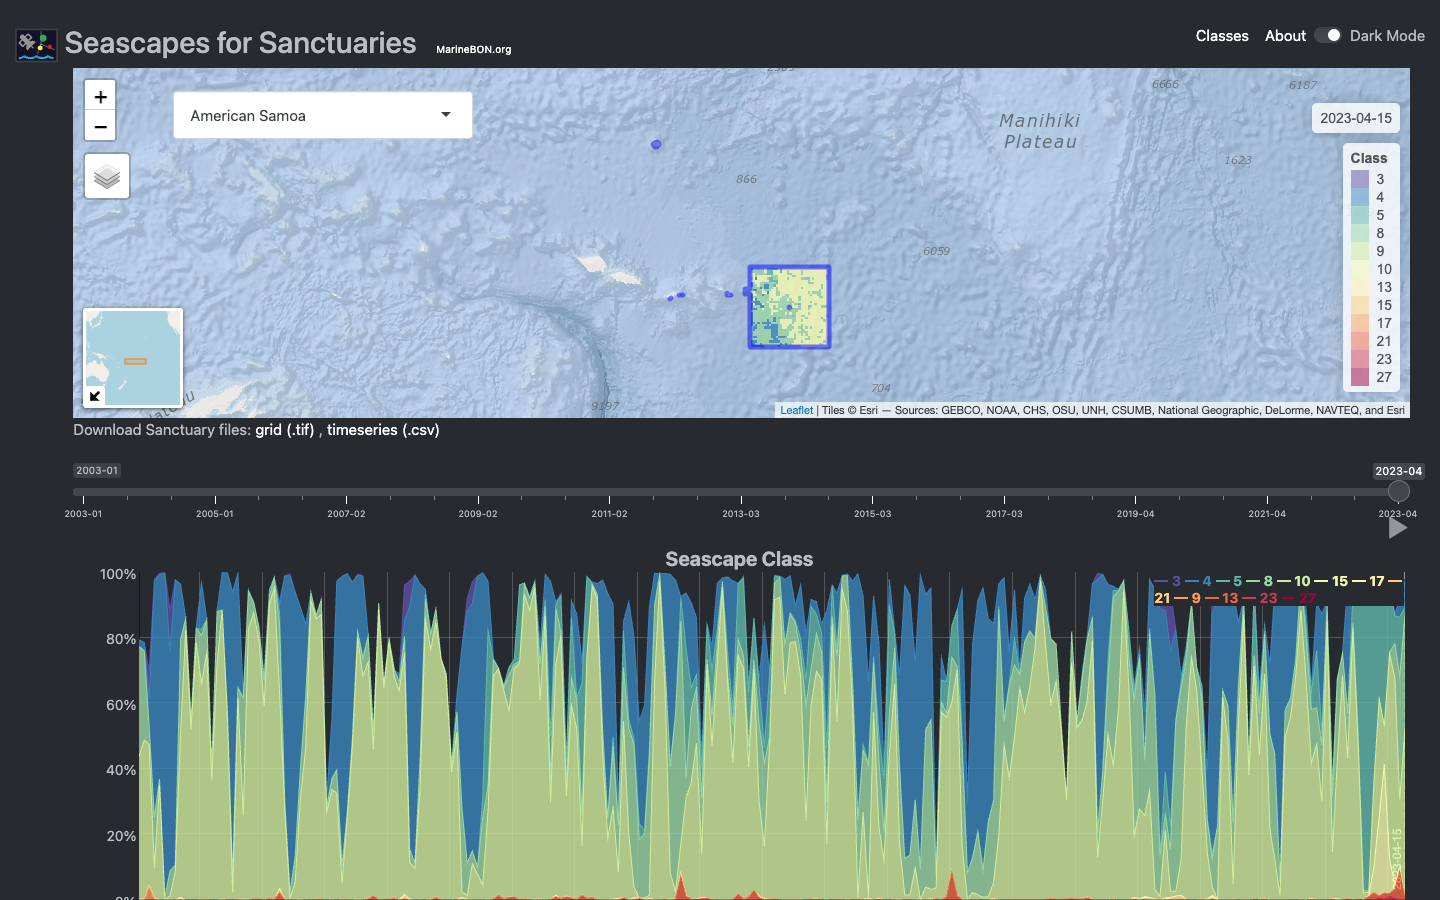
Seascapes Viewer
Interactive Shiny application for visualizing global Seascape Classes in time and space across U.S. National Marine Sanctuaries.
Learn more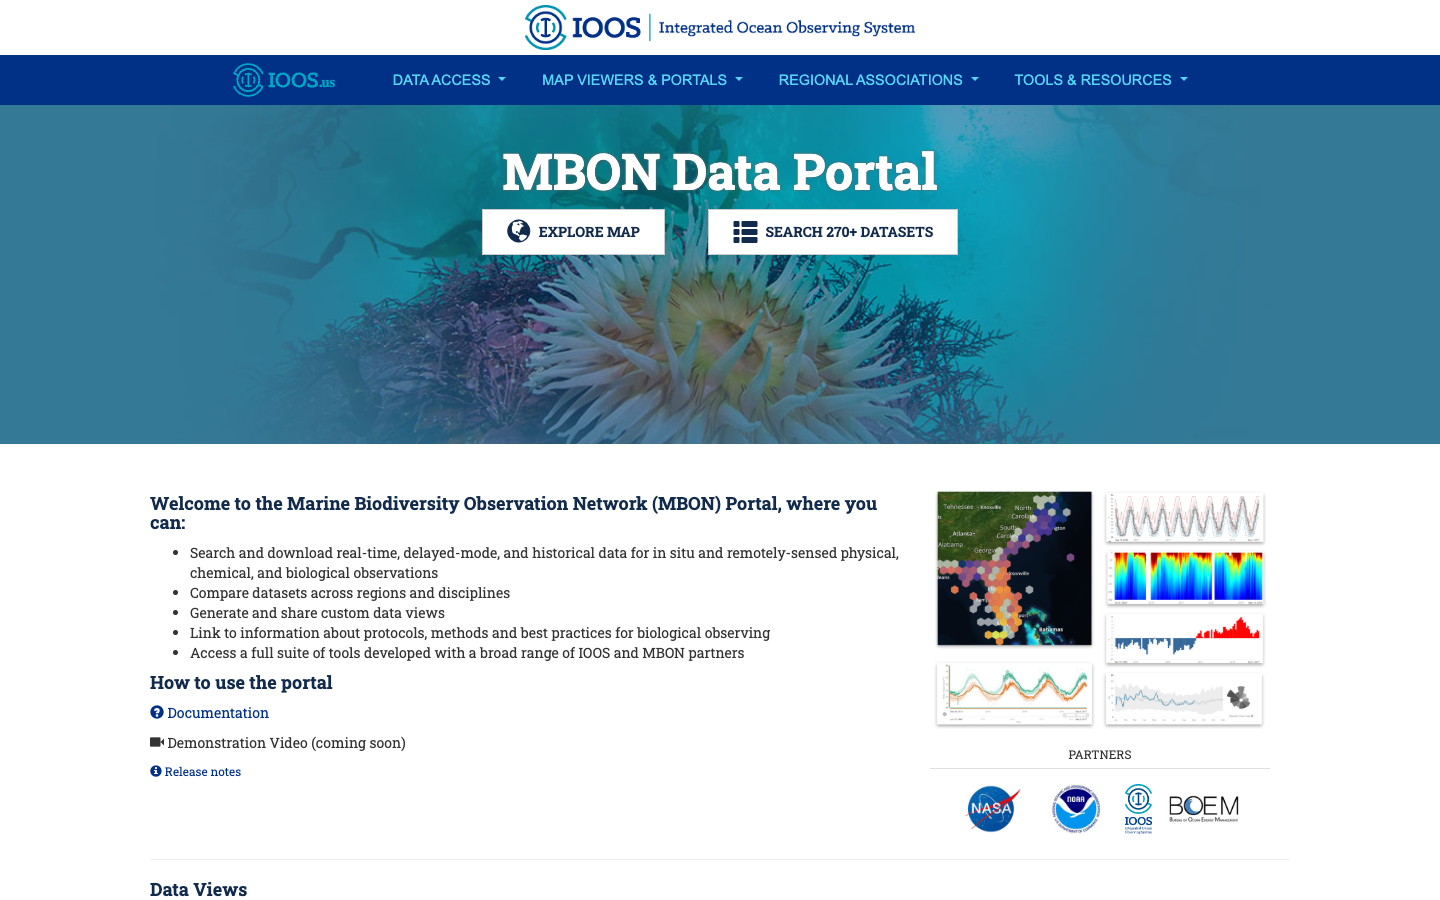
MBON Data Portal
Search, download, visualize, and analyze real-time, delayed-mode, and historical MBON biological observations alongside physical and chemical data.
Learn more